Silver Price Holds Near $58 as Analyst Flags $36–$44 Demand Zone
Key Takeaways
- •Silver was struggling to stay above $58 after a short-lived rebound from around $55 reversed lower.
- •Rishabhh Jain’s technical outlook points to a possible bounce toward $76–$79 before a renewed decline.
- •The bearish roadmap identifies $36–$44 as the major downside demand zone for silver.
- •A sustained move above $79 would weaken the bearish structure, while a break above $88 would invalidate it.
- •Silver’s near-term direction is also being affected by Middle East-linked oil moves and Federal Reserve rate expectations.
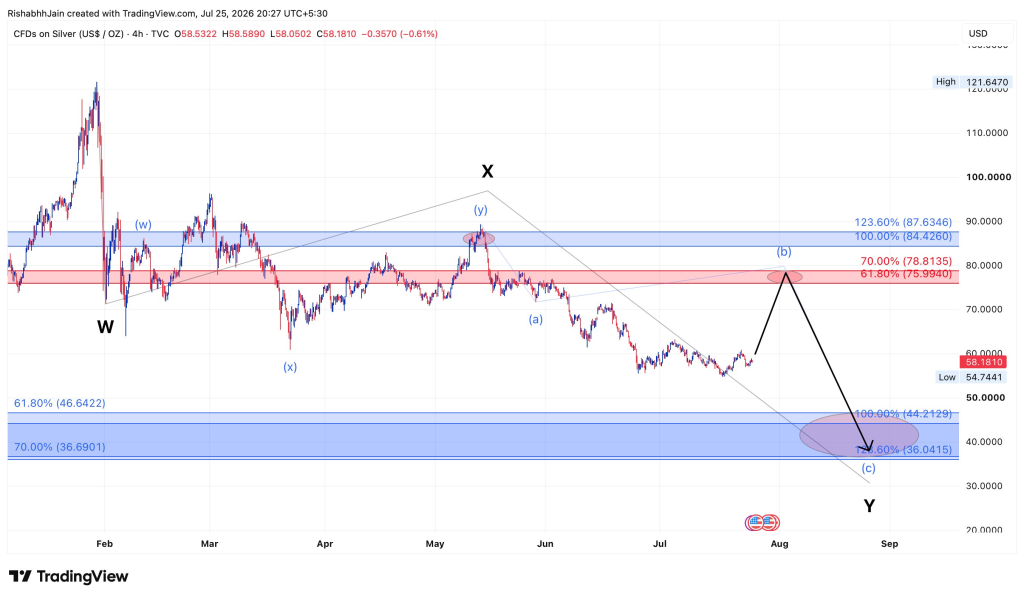
Silver was trading at $58 at press time after this week’s relief rally failed to hold. The metal briefly rebounded from the $55 area, but then turned lower again and is now struggling to remain above $58.
The broader precious metals market remains under pressure. Gold is holding near $4,050, while silver is showing the greater volatility that is typical of the metal. Silver often reacts both to safe-haven demand and to expectations for industrial activity, which can make its moves sharper than gold during periods of macroeconomic stress. The geopolitical backdrop remains mixed, with tensions in the Middle East continuing to affect oil markets and safe-haven flows.
Analyst Rishabhh Jain has outlined a bearish medium-term roadmap for silver, pointing to a major downside target in the $36–$44 zone.
Jain Sees Bounce, Rejection and Fresh Decline
In his latest silver analysis on X, Jain said the roadmap was unchanged: https://x.com/Rishabhh005/status/2081032822199124318?s=20
“The roadmap remains unchanged. A relief rally toward the $76–79 resistance zone cannot be ruled out. However, unless Silver reclaims and sustains above this supply area, the move is likely to remain corrective.”
He added:
“My primary expectation is: Bounce → Rejection → Fresh decline. The next major downside objective lies in the $36–44 demand zone, where the larger corrective structure could complete.”
Jain identified $76–$79 as the main resistance area and $36–$44 as the major demand zone.
He also cautioned about market psychology, saying: “Price doesn’t move in a straight line. It traps both bulls and bears before revealing its true direction. Patience and structure matter more than predictions.”
Silver Chart Analysis: Spike-and-Collapse Structure
The chart reviewed in the analysis covers silver’s price action from 2024 through 2026. It shows the surge to $121.67 on January 29, 2026, described as silver’s nominal all-time high, driven by a geopolitical shock involving conflict in the Middle East, oil moves and safe-haven buying. Silver then fell sharply and has spent the rest of 2026 unwinding that spike through a large, choppy correction.
The chart structure is presented through a W-X-Y corrective framework. In technical analysis, W-X-Y patterns are typically used to describe complex corrections rather than straightforward impulse moves, so the interpretation depends heavily on whether price respects the identified resistance and support zones.
Wave W began from the January low near $58, when silver surged to $121.67 before falling back to the mid-$70s. Jain treats that entire pump-and-collapse phase as the first leg, or Wave W, of a larger three-part W-X-Y correction.
Wave X followed as a sideways corrective structure from February through May. It formed a “flat top” pattern, with peaks near $87–$88, lows near $73 and another peak near $85–$88. The X apex near $97–$98 on the grey trendlines is now acting as a major resistance area.
Wave Y is still in progress, according to the analysis. The decline from the X high shows wave (a) falling to about $68 in June, followed by a small wave (b) bounce and a grind lower through July to the current low near $55–$58. Only wave (a) of Y appears complete on the chart. Jain expects a wave (b) rebound followed by a wave (c) decline to complete Wave Y.
Key Resistance and Support Zones for Silver
The black arrows on the chart represent the analyst’s projected path, rather than price action that has already occurred. The expected sequence is a corrective wave (b) bounce from current levels into the $76–$79 supply zone, followed by a decisive wave (c) move lower to complete Wave Y.
The downside target is $36–$44, with $44.21, the 100% extension, marked as the first objective and $36.04, the 123.6% extension, as the extended target.
This is a bearish medium-term count. Jain is treating the entire 2026 move as an A-B-C-style corrective sequence from the $121 pump that remains unresolved, with one more sharp move lower expected after a relief rally.
Risks to the Bearish Count and Potential Invalidation Levels
Elliott Wave counts are inherently subjective. The bearish structure is one valid interpretation, but alternatives cannot be ruled out, including the possibility that the low is already in or that silver is forming a bottoming base rather than remaining in the middle of a correction.
A move to $36–$44 would mean silver giving back nearly all of its 2025–2026 rally. The source analysis describes that as a large, low-probability move unless the underlying geopolitical and macroeconomic drivers reverse sharply.
Current news flow remains mixed and choppy. Silver rose 1.57% on July 24, 2026, although it remains slightly lower over the past month. Near-term direction is being influenced by Middle East-linked oil moves and Federal Reserve rate expectations, not only by technical factors. Rate expectations matter for precious metals because changes in real yields and the dollar can affect the relative appeal of non-yielding assets such as silver and gold.
Several developments could invalidate or weaken the bearish count. A sustained move above $79 would break the bearish structure and shift attention toward the upper resistance zone around $84–$87. A break above $88 would completely invalidate the bearish wave count. Changes in Fed policy, a weaker dollar or renewed geopolitical safe-haven demand could also override the technical picture.
If silver reclaims and holds above the $76–$79 resistance area, the bearish count would be significantly weakened. For now, Jain’s bearish roadmap remains in focus, with $79 standing out as the level that would change the structure described in the analysis.

