Silver Price Prediction: $61.40 Is the Key, But Analyst Warns of One More Decline
Key Takeaways
- •Silver surrendered its recent gains to trade near $57.85 after failing to sustain the relief rally that briefly pushed it above $60 earlier in the week.
- •Analyst More Crypto Online assesses that silver is forming an Elliott Wave 4 triangle pattern, with downside targets at $55.40 and $51 remaining active as long as price stays below $61.40.
- •The recent bounce from approximately $55 to $60 was rejected at a convergence of descending trendline resistance, previous swing resistance, and wave completion areas, reinforcing the bearish technical structure.
- •Silver failed to reach the 38.2% Fibonacci retracement level at $64.16 during its rally, which analysts interpret as a bearish signal indicating insufficient buying pressure for a trend reversal.
- •The current technical outlook assigns roughly 70% probability to a resumption of decline toward $51-52, while a sustained breakout above $62-63 would be needed to invalidate the bearish case.
Silver dropped below $60 again today after briefly reclaiming that level earlier in the week during a relief rally that also saw gold push above $4,100. At press time, silver is trading near $57.85, having surrendered most of its recent gains.
The broader precious metals complex remains under pressure. Gold is holding near $4,050, while silver continues to exhibit its characteristic higher volatility. Silver often moves more sharply than gold because it trades as both a monetary metal and an industrial input, making technical levels especially important when short-term momentum turns unstable. The relief rally proved short-lived.
Analyst More Crypto Online shared his latest assessment of silver's price action, pointing to the likelihood of one more decline before a major low forms.
More Crypto Online: Wave 4 Triangle Forming
More Crypto Online posted on X:
"Silver stuck in a broad sideways consolidation. Looks increasingly like a wave 4 triangle. Stay below $61.40 and another decline toward the lower boundary remains possible before a final lower high develops. Support at $55.40 then $51. Break above $61.40 and focus shifts to $64.16-$69.65. Even then, rallies have stayed corrective so far. Silver possibly approaching a major long-term low. Just not there yet."
The analyst is tracking two scenarios. Below $61.40, the bearish path remains active with downside targets at $55.40 and $51. Above $61.40, attention shifts to the $64.16–$69.65 range. However, even in the bullish case, he cautions that rallies have been corrective in nature so far.
Silver Chart Analysis: Descending Resistance and Elliott Wave Structure
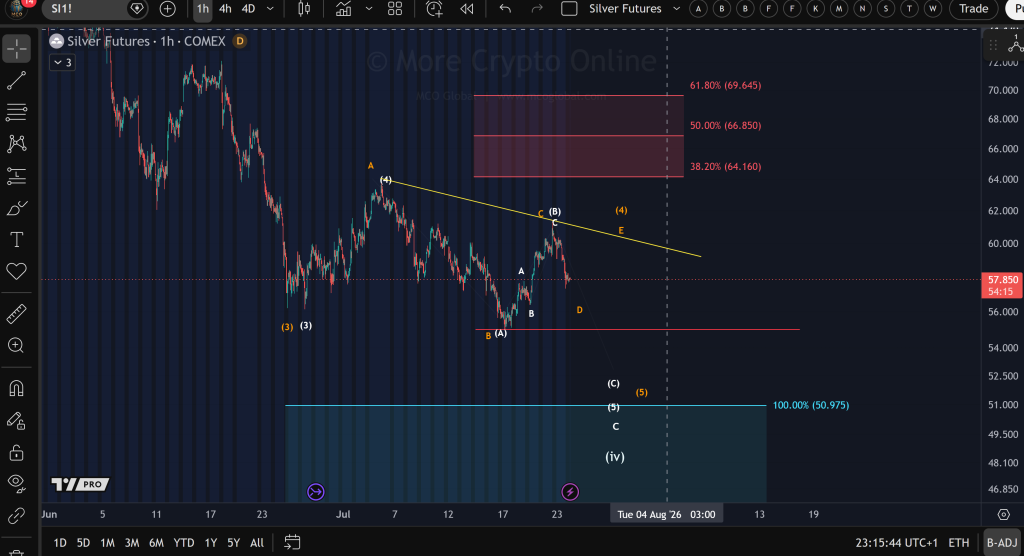
The 1-hour COMEX Silver Futures chart displays a combined Elliott Wave count, ABC correction, descending resistance trendline, and Fibonacci retracement and extension targets. COMEX futures are widely watched by metals traders because they provide a liquid reference point for short-term silver price discovery.
The dominant trend remains bearish. Lower highs have formed since the early July peak, and lower lows continue to develop. Price has stayed below a descending yellow trendline, and every rally attempt has been met with selling pressure.
The recent bounce from approximately $55 to $60 failed precisely where one would expect in a bear trend— at the intersection of descending resistance, previous swing resistance, and the wave C/B completion area. That rejection carries technical significance.
From an Elliott Wave perspective, the move from the July high down toward $55 appears impulsive, likely representing Waves 1, 2, and 3. The subsequent move off $55 looks corrective rather than impulsive, characterized by overlapping candles, choppy structure, slow momentum, and no strong breakout — all classic correction traits. The pattern resembles an ABC correction, consistent with the chart labels. In this framework, analysts use the distinction between impulsive and corrective moves to judge whether a trend is continuing or whether a countertrend rally is developing.
The descending trendline stands as the most critical technical feature at present. It has rejected price on multiple occasions. Until this line is decisively broken, bears retain control.
The rejection from the rally to $60 occurred almost exactly where wave C ended, where wave B ended (in the alternate count), and where trendline resistance sits. Three resistance factors aligned simultaneously, creating a high-probability sell zone.
Fibonacci Levels and Key Silver Price Zones
Fibonacci resistance levels:
- 38.2% at $64.16 — Silver did not even reach this level during the rally, which is a bearish signal. Strong bullish reversals typically recover at least 38%. Failure to reach this threshold suggests weak buying pressure.
- 50% at $66.85
- 61.8% at $69.65
Downside projection: The blue target zone terminates around $50.98. If this move constitutes a Wave 5 or Wave C, a decline toward $51–52 is entirely plausible. That target aligns with prior support, measured extension, and the Elliott equality projection.
Momentum: The rally lacks the hallmarks of a new bull trend. Overlapping candles, declining momentum, and lower swing highs all favor continuation to the downside.
Trading Outlook
Short-term (1–3 days): Bearish. The rejection from descending resistance signals that sellers remain in control.
Medium-term (1–3 weeks): Moderately bearish. If price breaks below $55, the path toward $51–52 becomes the higher-probability scenario.
Bullish invalidation: A sustained move above the descending trendline followed by a break above $62–63 would invalidate the immediate bearish wave count and increase the probability of a broader recovery toward the $64–67 Fibonacci region.
Silver Price Action Assessment
The bearish case for silver is reinforced by the confluence of Elliott Wave completion, descending trendline resistance, and repeated lower highs. The next decisive level is $55. A break below it would significantly strengthen the case for another impulsive leg lower.
The current technical picture suggests approximately:
- 70% probability: The recent rally was an ABC corrective bounce, and silver resumes its decline toward $51–52.
- 30% probability: The rally from $55 develops into a genuine trend reversal, though this would require a confirmed breakout above the descending trendline and key swing highs.
Silver appears to be approaching a major long-term low, but the evidence suggests it has not arrived there yet. The $51–55 zone is where technicians may look for signs of whether selling pressure is exhausting or whether the downtrend remains intact.

