Gold Posts Major Bullish Breakout as USD Debasement Narrative Grows
Key Takeaways
- •Gold gained 4.35% on 19 August to close at $4,523, marking its largest single-day rise since February 2026.
- •The metal climbed about 10% from a potential swing low of $3,942 on 30 June to the 18 August close of $4,335.
- •The US Treasury doubled its buyback program for 10- to 30-year bonds from $2 billion to $4 billion per operation after the 30-year yield reached 5.31%.
- •The 30-year US Treasury yield fell 10 basis points to 5.19% on 19 August, while the US Dollar Index dropped to a three-month low.
- •Gold is trading within an ascending channel, with support around $4,434/$4,405 and resistance near $4,504, $4,580 and $4,640.
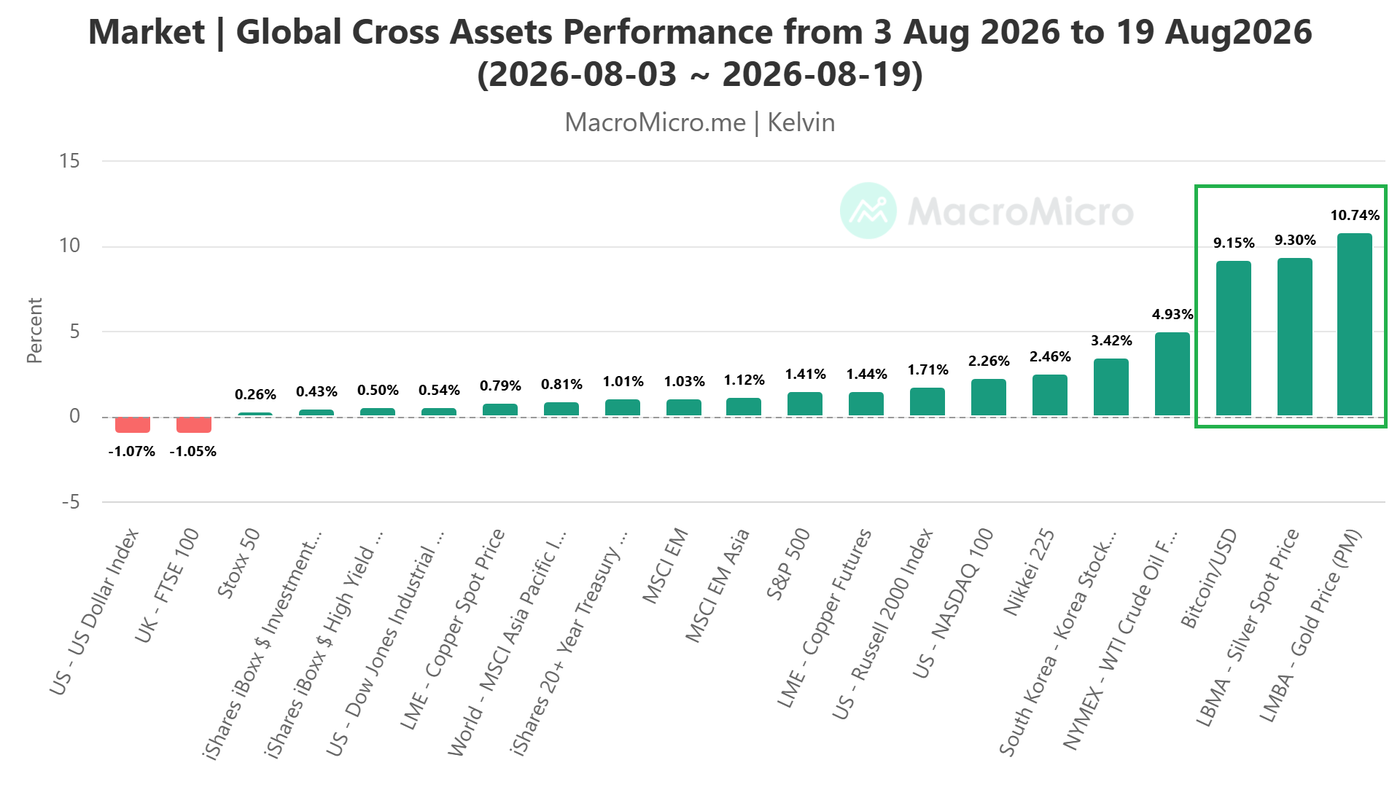
Gold (XAU/USD) has extended its strong advance since the start of August 2026. From a potential major swing low of $3,942 printed on 30 June 2026, the metal rallied 10% to Tuesday, 18 August 2026’s close at $4,335.
On Wednesday, 19 August 2026, gold added another 4.35% to finish at US$4,523, its largest single-day gain since February 2026. Spot gold, as quoted by the London Bullion Market Association, has now moved from being a relative underperformer in July 2026 to the top performer month-to-date as of 19 August 2026, with a gain of 10.7% across major cross-asset classes. It was followed by spot silver at 9.3% and Bitcoin/USD at 9.1%.
US Treasury buybacks, fiscal dominance and USD debasement
The latest rally in gold has been widely linked to the US Treasury’s sudden decision to double its buyback program for long-dated US Treasury bonds, covering maturities from 10 years to 30 years, from $2 billion per operation to $4 billion per operation. The move was aimed at restraining long-term borrowing costs after the 30-year US Treasury yield climbed to a 19-year high of 5.31% at the start of the week. Buyback operations see the Treasury repurchase outstanding longer-dated securities, funded by issuing shorter-dated debt — in effect swapping the composition of federal borrowing to relieve supply pressure at the long end of the curve.
The larger buyback program helped push the 30-year yield down by 10 basis points to 5.19% on Wednesday, 19 August 2026, although that remained near a 19-year high.
Some market commentary has interpreted the move through the lens of interest rates, arguing that lower long-term Treasury yields reduce the opportunity cost of holding gold, a non-income-bearing asset, and may have reinforced demand for the metal.
However, the price action in gold since the end of June 2026 has unfolded while the 30-year US Treasury yield has actually risen by 44 basis points over the same period. That has led traders to focus less on yields alone and more on a US dollar purchasing-power argument, or what some are describing as a USD debasement narrative.
Wednesday’s sharp move in gold also came as the US Dollar Index (DXY), which measures the dollar against a basket of major currencies, fell to a three-month low. Because gold is priced in US dollars, a weaker greenback tends to make bullion cheaper for holders of other currencies, one reason the two assets often move inversely. The reaction is being viewed by some as a “panic intervention” by the US Treasury and as evidence of fiscal dominance, a framework in which fiscal debt management takes precedence over monetary discipline.
When government bodies step in to support sovereign bond markets amid persistent deficit spending, market participants may quickly reprice the risk of long-term USD debasement. In that setting, non-yielding bullion can benefit as a store of value that is not exposed to counterparty risk or inflation risk. The debasement argument also lands on fertile ground: central banks have been persistent large net buyers of gold since 2022, a shift widely attributed to reserve diversification away from dollar assets after the freezing of Russia’s foreign reserves that year, and tracked in World Gold Council data as a structural source of bullion demand.
Potential start of a new medium-term bullish impulse
Gold’s six-month corrective decline of 30% from its current all-time intraday high of $5,602 on 29 January 2026 is likely to have ended on that date. Weekly price action has rebounded from the lower boundary of a major ascending channel that has been in place since the October 2023 low, and price has also moved back above the 50-day moving average. A weekly bullish reversal candlestick pattern followed in the week of 3 August 2026.
In the short to medium term, gold is now moving within an ascending channel that has been in place since the 3 August 2026 low of $4,019.
The key short-term support to watch is $4,434/$4,405. Holding above that area would keep the multi-day bullish impulsive move intact. A clear break above near-term resistance at $4,504, which is also close to the key 200-day moving average, would strengthen the bullish setup and open the way to the next intermediate resistances at $4,580 and $4,640.
On the other hand, failure to hold and an hourly close below $4,405 would negate the bullish tone and could trigger another minor corrective pullback toward the next intermediate support at $4,320, which also marks the lower boundary of the ascending channel.
Alongside these chart levels, the pace and scale of the Treasury’s expanded buyback operations, the behavior of the 30-year yield and further direction in the US Dollar Index are the macro reference points traders are watching as the market tests whether the breakout holds.
Opinions are the authors’ and do not necessarily reflect those of OANDA Business Information & Services, Inc. or any of its affiliates, subsidiaries, officers or directors. This publication is provided for informational and educational purposes only. For reproduction or redistribution of content from MarketPulse, please refer to the MarketPulse Terms of Use at https://www.marketpulse.com/terms-of-use/. Visit https://www.marketpulse.com/ to learn more about the global markets coverage from OANDA Business Information & Services Inc. © 2026 OANDA Business Information & Services Inc.

