Silver Institute Report Says Gold-Silver Ratio Remains Relevant in Modern Markets
Key Takeaways
- •The gold-silver ratio measures how many ounces of silver are needed to buy one ounce of gold at current spot prices.
- •A Silver Institute analysis found a long-run gold-silver ratio equilibrium of 59.65 using data from January 1970 to May 2026.
- •The ratio has recently widened to around 70-to-1 after falling to 43-to-1 during a January silver spike.
- •Past extreme readings include a 30-to-1 ratio in 2011 and a record 123-to-1 ratio during Covid-related market turmoil in 2020.
- •The article says the ratio remains a relative-value tool rather than a standalone forecast for gold or silver prices.
By Mike Maharrey
The gold-silver ratio has recently widened to around 70-1, a move the author previously described as a bullish signal for silver. The broader question is whether the metric remains useful in today’s markets.
Some analysts argue that it does not. They describe the ratio as a relic from an earlier period when both gold and silver played formal roles in the global financial system, and they contend that it provides limited insight into modern precious-metals markets.
A report from the Silver Institute reaches a different conclusion. According to the report, the gold-silver ratio may be more relevant today than in the past. Its statistical analysis found that “the price correlation between the two precious metals has actually strengthened over the past two decades as gold and silver markets have become increasingly financialized.”
That question matters because the ratio is still used as a relative-value tool rather than a standalone price forecast. It compares one precious metal against another and can help frame whether a move in silver is occurring alongside, ahead of, or behind a move in gold.
What the Gold-Silver Ratio Measures
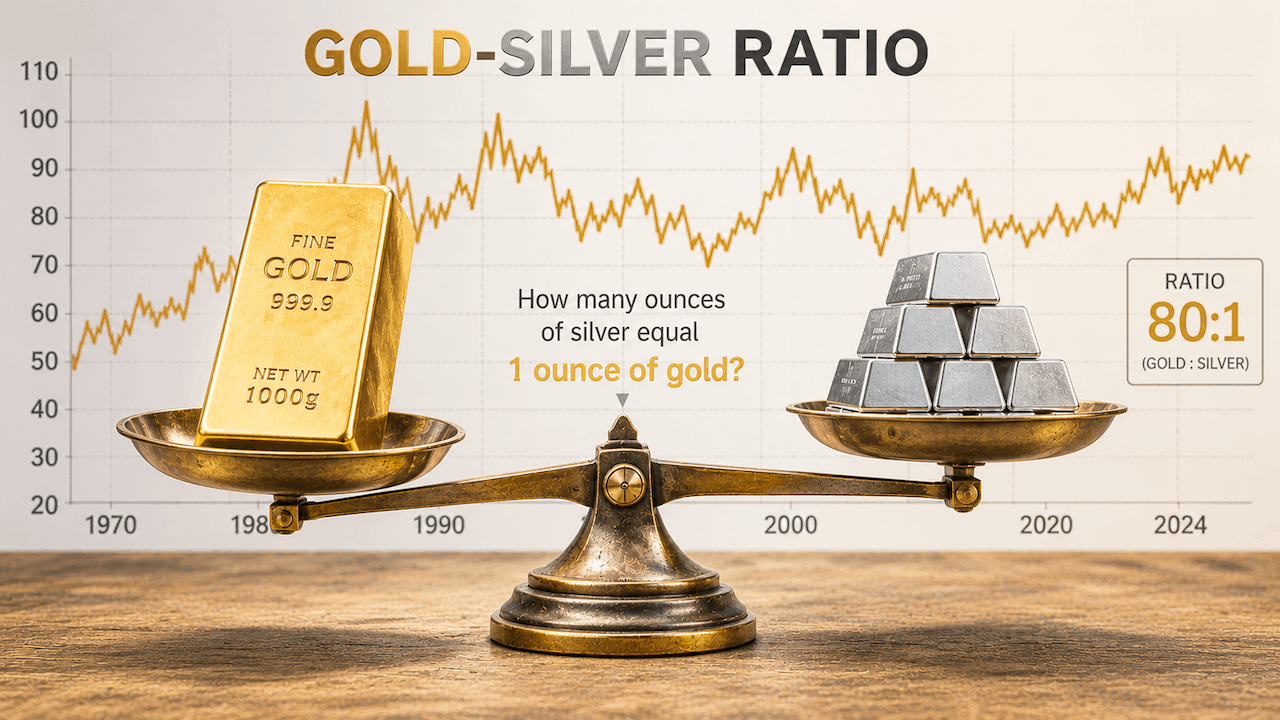
The gold-silver ratio shows how many ounces of silver are required to buy one ounce of gold, based on the current spot prices of both metals. Put another way, it expresses the price of gold in ounces of silver.
Because gold and silver prices have historically tended to move together, their relative price relationship has been used by technical analysts to assess potential market dislocations and anticipate price movements.
Historically, when the gold-silver ratio has moved well above its long-term average, it has indicated that silver is underpriced relative to gold. Under that interpretation, silver may later rise relative to gold as the ratio moves back toward its historical range.
Between roughly 3,000 BC and the 1800s, the gold-silver ratio was an important market signal. The Silver Institute described it as “arguably the single most important financial indicator.”
During periods when both gold and silver were central to monetary systems, governments often set the ratio by decree. The earliest recorded imposed gold-silver ratio was established by King Menes of Ancient Egypt at 2.5-1.
Rome set a gold-silver ratio of 8-1 in the early years of the empire in 210 BCE. As gold and silver entered Rome through conquest, the ratio fluctuated, reaching as high as 12-1. Julius Caesar later established a ratio of 11.5-1, and Augustus raised it to 11.75-1.
Bimetallic monetary systems eventually proved difficult to manage. European countries began demonetizing silver in the mid-19th century. The United States followed the lead of England, Portugal, Germany and other nations by establishing a gold standard through the Coinage Act of 1873.
After silver was demonetized, the gold-silver ratio was left to float freely. By World War II, the average ratio had widened to as much as 40-1.
The Ratio in the Modern Era
In the modern period, the gold-silver ratio has generally averaged between 40-1 and 60-1.
Although some analysts argue that the relationship between the two metals is breaking down, the Silver Institute report says gold and silver continue to maintain that relationship.
“The gold-silver ratio is not a ‘random walk’ but mean-reverting. A Johansen Cointegration Test on the data from January 1970 to May 2026 generated a long-run equilibrium for the ratio of 59.65. Periods of disequilibrium therefore indicate over- or undervaluation of gold or silver. Moreover, despite the massive inflation in the price scales for these precious metals over the past 56 years, the core gold-silver relationship is still bound to a central axis.”
In that analysis, the average gold-silver ratio remains close to 60-1, and significant deviations from that level point to dislocation in one or both markets. The reference to mean reversion is important: it implies that extreme readings have historically tended to move back toward a longer-run relationship, even though the path and timing of that adjustment can vary.
The Silver Institute summarized the point by saying, “Periods of extreme market disequilibrium serve as clear signals of major over- or undervaluation in either gold or silver, rather than a permanent structural break.”
Shorter-term changes in the relative supply and demand of gold and silver can move the ratio into and out of equilibrium. Over the past 20 years, the ratio has widened and then returned toward its mean several times. Those contractions in the ratio have typically occurred during gold bull markets in which silver outperformed gold.
For example, the gold-silver ratio fell to 30-1 in 2011 after rising above 80-1 during the money creation associated with the Great Recession following the 2008 financial crisis.
In 2020, the ratio reached a record 123-1 as Covid-related turmoil spread globally. It then dropped to around 60-1 as central banks increased money creation in response to government shutdowns of large parts of the economy.
More recently, the ratio traded between 80-1 and 100-1 in the months before the October 2025 price rally, briefly moving above 100-1 in March 2025. At that time, the author wrote that the wide ratio indicated significant upside for silver and forecast that silver would ultimately rise to close the gap. As silver spiked in January, the gold-silver ratio fell to 43-1, placing it near the low end of its historical average.
The author argues that the gold-silver ratio continues to serve as a useful tool for technical analysis. The Silver Institute report also states that the ratio remains relevant even though silver is no longer formally used in the global financial system.
“While the demise of formal bimetallic, silver and gold monetary standards over more than a century through to 1971 structurally shifted the baseline ratio, the structural relationship between gold and silver has continued into the modern era.”
Under this framework, a wide gold-silver ratio indicates that silver is relatively inexpensive compared with gold. The gap can close either through a decline in gold or a rise in silver. Historically, according to the author, the gap has most often closed through a silver rally.
For market watchers, the key issue is whether future wide or narrow readings continue to behave as temporary deviations from the long-run relationship identified in the report, or whether new supply, demand, and trading patterns begin to change that relationship over time.
The full Silver Institute report is available here.

