Gold-Silver Ratio Explained: What the Signal Means
Key Takeaways
- •The gold-silver ratio measures how many ounces of silver equal the value of one ounce of gold by dividing the gold price by the silver price.
- •As of July 27, 2026, MetalsCharts showed the ratio near 69.0, with a 52-week range of 46.3 to 90.8.
- •The Silver Institute’s July 2026 research placed the ratio’s long-run mean-reverting equilibrium slightly below 60 based on data from 1970 through May 2026.
- •UBS noted in mid-July that silver ETF holdings had fallen by more than about 38 million ounces to roughly 784 million ounces.
- •The ratio can provide macro context for metals, risk assets and crypto markets, but it is not a reliable standalone trading or prediction signal.
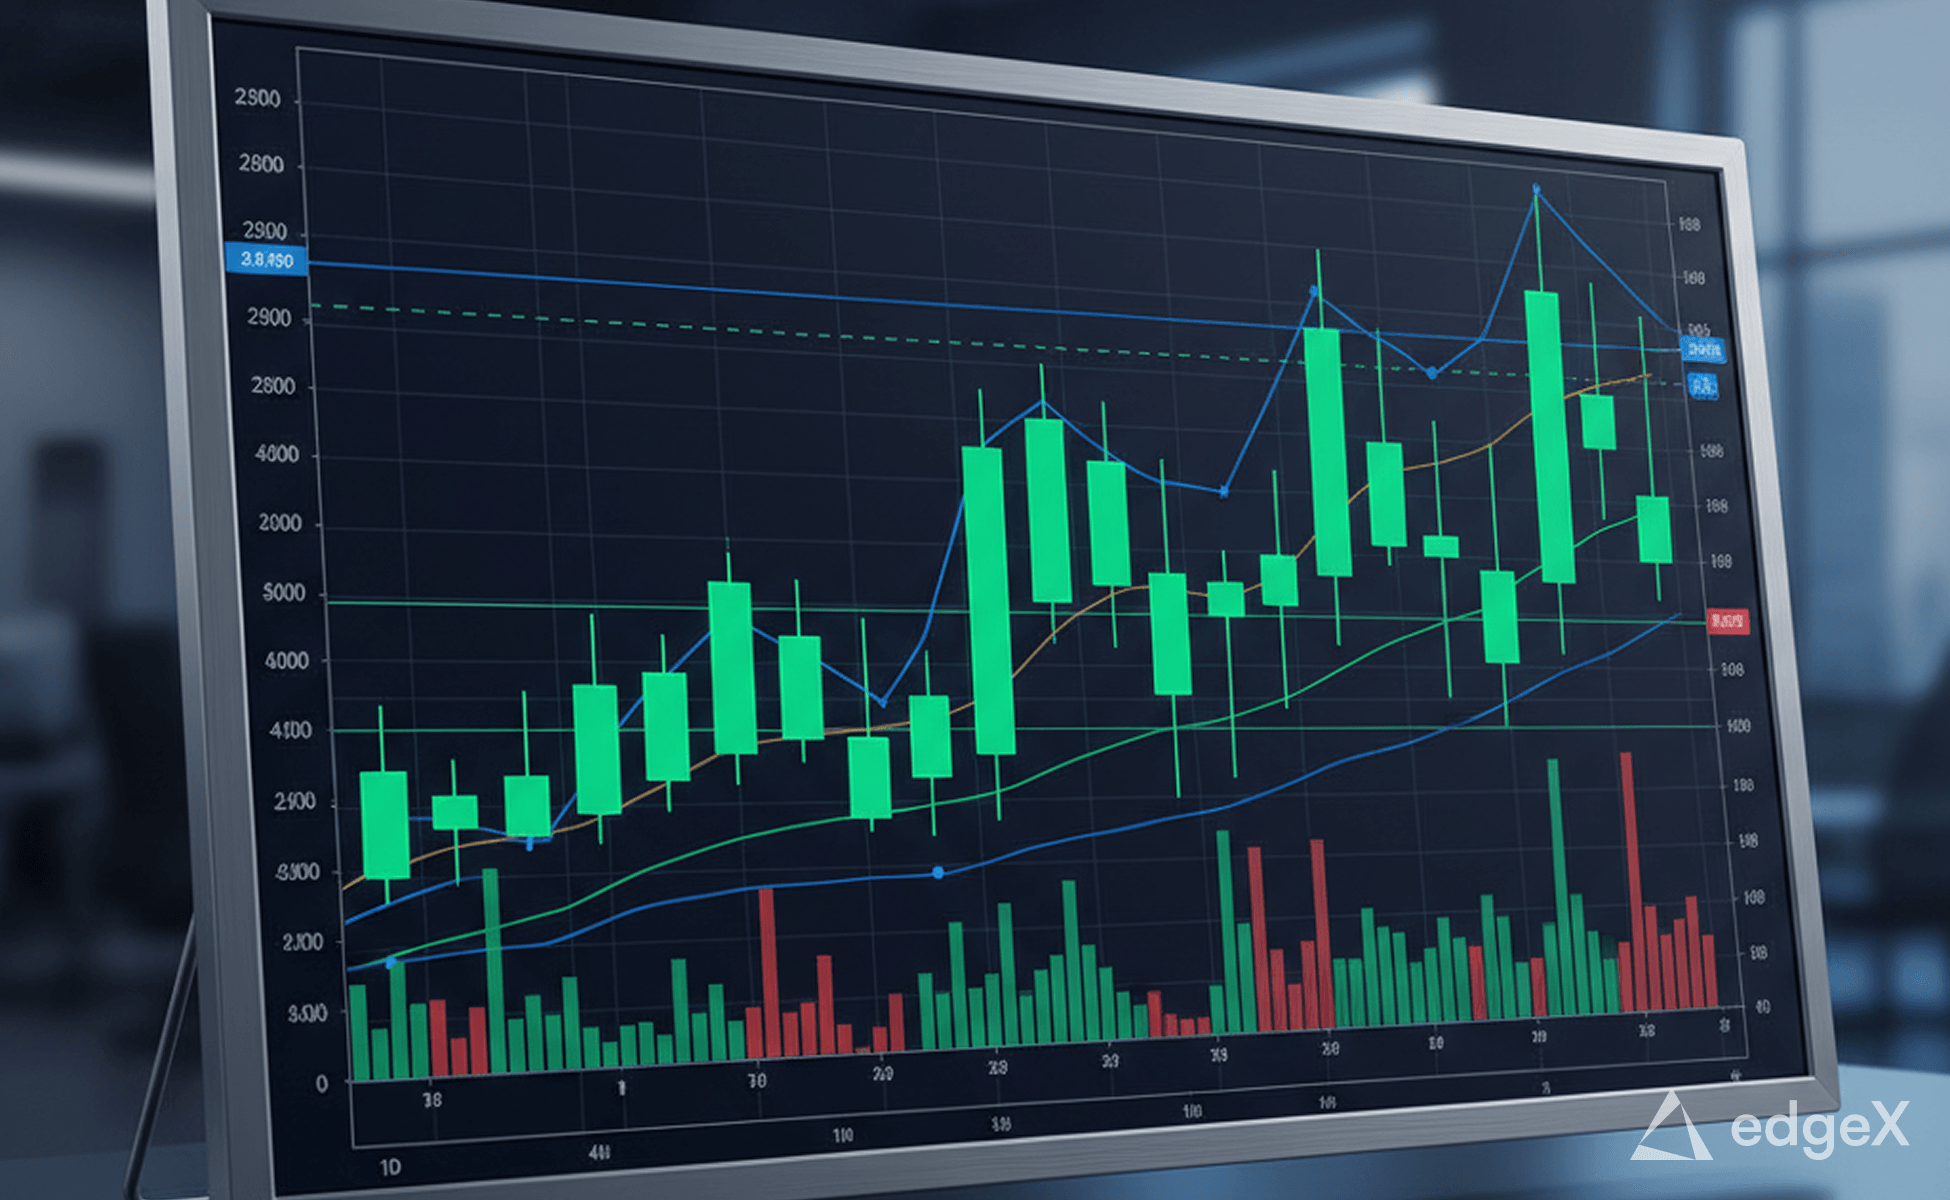
The gold-silver ratio is a straightforward measure comparing the prices of two precious metals. It divides the price of gold by the price of silver and shows how many ounces of silver are equivalent in value to one ounce of gold.
Some traders treat the ratio as an important gauge for precious metals. Others pay little attention unless it reaches unusually high or low levels. In either case, it remains a widely watched signal because it can reflect shifts in macro conditions, liquidity, industrial demand, and demand for perceived safe-haven assets.
For investors and traders following gold, silver, crypto assets, or broader risk markets, the ratio can provide context on whether conditions appear more defensive or more growth-oriented. It is not a standalone trading tool or a prediction mechanism, but it can function as one indicator within a broader market framework.
Key reference points include the following: the ratio is calculated by dividing the gold price by the silver price; a higher number means gold is expensive relative to silver; research covering 1970 through May 2026 suggests a mean-reverting equilibrium just under 60:1, according to the Silver Institute; as of July 27, 2026, the ratio was near 69.0, with a 52-week range of 46.3 to 90.8, according to MetalsCharts; high readings often coincide with caution, liquidity stress, softer industrial demand for silver, or stronger safe-haven demand for gold; traders may use the ratio for pairs trades, hedging, or tactical portfolio tilts; and the main risks include extended trends, costs, slippage, leverage, and treating a noisy macro signal too literally.
What the gold-silver ratio measures
The calculation is simple. Take the current gold price per ounce and divide it by the current silver price per ounce. If gold is 4,000 and silver is 50, the gold-silver ratio is 80. That means one ounce of gold has the same value as 80 ounces of silver.
Because it is a relative measure, the ratio can rise or fall even when both metals move in the same direction. It rises when gold outperforms silver and falls when silver outperforms gold. That distinction matters because a ratio trade is usually about relative performance, not simply whether either metal is rising in absolute terms.
The ratio moves because gold and silver respond to different forces. Gold is widely used as a monetary hedge and long-term store of value. Silver also has an investment role, but it has a larger industrial component. It is used in solar products, electronics, and many manufacturing applications.
When investors become more cautious, gold can attract demand faster than silver. When industrial activity strengthens and green technology demand rises, silver demand can recover sharply. As a result, the gold-silver ratio reflects a mix of macro sentiment, industrial cycles, mining supply, and investment flows.
In that sense, the ratio is not simply a charting convention. It is a compact way to observe how markets are pricing safety relative to growth at a specific point in time.
Editor Maya Collins noted that she spent much of Q1 and Q2 watching metals as a backdrop to crypto risk. During weeks when the gold-silver ratio remained in the high 60s, she said BTC appeared more volatile and altcoin desks were selective with liquidity. She also cited comments from commodities contacts about steady silver ETF outflows, which aligned with cross-asset rotation patterns. Her takeaway was not a specific trade but a workflow adjustment: tracking the ratio alongside funding rates and dollar strength.
Where the ratio stood in late July 2026
As of July 27, 2026, the live gold-silver ratio was about 69.0, with the previous year ranging from roughly 46.3 to 90.8, according to MetalsCharts. That range shows that the spread can move far and quickly, especially around macro shocks.
Earlier in the month, on July 15, the ratio reached 70:1 as silver slipped while gold held firm, according to market commentary from GoldSilver. On July 21, UBS noted that the ratio was just above 70x and pointed to sizable year-to-date outflows from silver ETFs. Holdings had fallen by more than approximately 38 million ounces to about 784 million ounces by mid-July, according to Investing.com, which quoted the UBS note.
A broader historical view gives additional context. A recent Silver Institute study suggested the ratio has a long-run, mean-reverting equilibrium slightly below 60, based on data from 1970 through May 2026. Against that reference point, a reading near 69 appears elevated relative to the long-run average, though it is not at the extreme levels seen during some crisis spikes.
How to read the signal carefully
Use bands rather than fixed numbers
The gold-silver ratio does not move according to fixed round-number rules. Terms such as high and low depend on the broader macro regime. A ratio of 70 in one cycle may behave differently from a ratio of 80 in another. Traders often treat levels as zones rather than precise triggers.
The ratio is generally more useful when it lines up with other indicators, including price action, ETF flows, dollar strength, funding conditions, and broader market liquidity.
Mean reversion can take time
The Silver Institute’s estimate of mean reversion near 60 can help frame expectations, but the return toward a long-term zone can take time. A trader can be directionally correct about the ratio but still be early on timing. That matters when positions involve financing costs, short-leg exposure, roll costs, or leverage.
Confirmation matters
If the ratio is elevated and a trader expects silver to outperform gold, confirmation may include silver stabilizing against gold, the ratio beginning to fall, silver making higher highs or higher lows relative to gold, or ETF outflows slowing.
When flows remain negative, momentum can keep the ratio elevated for longer. UBS’s comments on silver ETF outflows in mid-2026 are an example of a backdrop that can delay mean reversion.
A cleaner signal may appear when the ratio rejects a previous extreme and rolls over with stronger market participation, rather than when traders try to identify a top without confirmation.
How traders use the ratio
Pairs trades
One common approach is a pairs trade. When the ratio is elevated, some traders go long silver and short gold in equal dollar terms, seeking to benefit if silver outperforms and the spread narrows. When the ratio is depressed, they may take the opposite approach.
The goal is not necessarily to identify exact peaks or troughs. Rather, the trade is based on the tendency for the ratio to cool toward its long-run range over time. However, spreads can widen before they narrow, and trading costs can materially affect results. Borrow costs, fees, and slippage matter. In spot metals, storage costs and premiums can reduce returns. In futures markets, roll costs and margin risk are important.
Portfolio tilts
Less active market participants may use the ratio as a rebalancing input rather than a direct trading signal. For example, when the ratio appears stretched high relative to history, some may gradually increase silver exposure by a modest amount and later normalize exposure if the ratio relaxes.
Such adjustments are typically framed as tactical tilts rather than all-or-nothing allocation changes. Position sizing, transaction costs, and time horizon remain central considerations.
Hedging physical holdings
Holders of physical coins or bars sometimes use futures or ETFs to hedge relative exposure when the ratio appears stretched. The aim is to reduce relative underperformance risk without selling physical holdings. Basis risk, liquidity, and position size are important in this type of structure.
In general, a stretched high ratio versus history may lead some traders to favor silver over gold on the margin, while looking for confirmation from a falling ratio, silver relative strength, and slowing ETF outflows. A mid-range and drifting ratio may encourage a neutral stance or small tactical positions while waiting for breakouts or macro catalysts. A stretched low ratio versus history may lead some traders to favor gold over silver on the margin, especially if the ratio bases higher, macro conditions turn more defensive, or gold begins leading.
No spread framework protects against excessive leverage, liquidity shocks, or policy surprises. Risk management, realistic position sizing, and a clear exit framework remain essential.
Macro and crypto context
When the gold-silver ratio rises, it often coincides with more cautious market conditions. Investors may favor gold’s safe-haven qualities while silver’s industrial exposure lags. When the ratio falls, it can reflect stronger appetite for growth-sensitive assets as silver attracts more demand.
The connection to crypto is indirect. Bitcoin and other risk assets can move with broader liquidity conditions when liquidity is abundant, and a falling ratio during a risk-on phase can coincide with stronger demand for BTC and higher-beta altcoins. However, the relationship is not reliable or mechanical.
Crypto markets have their own drivers, including ETF flows, on-chain narratives, exchange liquidity, regulatory developments, and token-specific catalysts. The gold-silver ratio should therefore be treated as macro context, not as a crypto trading signal.
One practical use is confluence. If a crypto setup is already supported by other factors and the gold-silver ratio starts falling from elevated levels, that may provide additional macro context. Conversely, if the ratio rises sharply while a portfolio is heavily exposed to high-beta assets, it may indicate a more defensive cross-asset backdrop.
Data sources and charting methods
Live ratio charts are available from sources such as MetalsCharts, which publishes current readings and recent ranges.
For long-run context, the Silver Institute’s July 2026 report discusses mean reversion and decades of historical data. ETF flows can be tracked through silver ETF holdings and through notes from major market desks, including UBS commentary reported by reputable outlets such as Investing.com.
On charting platforms, users can often plot XAUUSD divided by XAGUSD directly. If that is not available, a custom indicator can divide gold by silver, with a weekly timeframe helping to reduce short-term noise.
Consistency matters when comparing readings across platforms. A ratio based on spot gold and spot silver may not match a futures-based ratio exactly, and prices should be compared in the same currency and unit to avoid calculation noise.
Traders often overlay major macro events on ratio charts, including Federal Reserve meetings, energy price shocks, and large risk events. The ratio can react around those dates, particularly when liquidity expectations or growth assumptions change.
Risks and common traps
One-sided narratives
A high gold-silver ratio does not automatically mean silver will rally sharply. It may mean silver outperforms from that point, but it could also mean gold remains firm while silver moves sideways, or that both metals fall while silver falls less. The relevant question is what type of outperformance is needed for a specific position to work.
Ignoring flows and positioning
ETF flows and market positioning can influence the persistence of a trend. When ETF holdings continue to decline, weakness can extend. UBS’s comments on multi-month silver ETF outflows in 2026 underscore the importance of checking who is buying and who is exiting. Positioning surveys and CFTC data, where available, can also provide context.
Cost drag
Futures spreads involve roll costs. ETFs charge fees and may have tracking differences. Physical metal trades include premiums, bid-ask spreads, storage considerations, and potential tax issues. These frictions can reduce or erase the theoretical edge implied by a ratio trade.
Leverage and timing
Mean reversion can take quarters. Leveraged positions that require a quick move may be vulnerable to volatility and margin pressure. Any use of leverage requires a plan that allows for an extended timeline and the possibility of being early.
Structural shifts
Long-run averages are not permanent laws. Solar demand, new mining supply, changes in central bank gold buying, or policy shifts affecting industrial metals can alter the equilibrium. The long-run ratio is best viewed as a guidepost rather than a fixed fair value.
A historical gold-silver ratio infographic covering 1970 to the present and showing the long-term range and recent peaks can help place July 2026 readings near 69 to 70 in a multi-decade context, according to BullionLens.
Factors to watch into year-end
Silver demand from renewables and electronics remains important because a stronger industrial cycle usually helps silver narrow the gap with gold.
The path of interest rates and the tone of the dollar also matter. A softer dollar and easier policy conditions often support pro-cyclical assets, including silver.
ETF flows are another key variable. Stabilizing or reversing outflows can mark turning points. UBS’s mid-2026 view still showed net negative silver ETF flows.
Energy prices can affect mining costs and industrial margins, both of which feed into silver’s economics. Geopolitical risks can also influence the ratio, as sharp risk-off episodes may keep gold ahead of silver for longer and extend elevated readings.
These factors are not silver-only issues. They are cross-currents across commodities, rates, currency markets, and risk assets. Together, they suggest that the ratio tends to relax more easily when growth and liquidity conditions are more supportive.
Recent market context
In mid-July 2026, the ratio was around 70 as silver weakened and gold held steadier. That type of level often attracts attention from traders looking for potential silver catch-up. A week later, the live reading near 69 remained in the same area.
For those using the long-run pull toward roughly 60 as a reference point, this range may be viewed as a zone for gradual planning rather than an all-in allocation shift. The complication, as UBS highlighted, was persistent silver ETF outflows. Until those outflows slow, adverse market days may continue to favor gold relative to silver.
A clearer change in the setup would involve several weeks of the ratio trending lower while silver makes higher lows against gold, combined with flattening outflows or small inflows into silver products. Such a combination has often preceded more durable phases of silver outperformance.
Frequently asked questions
How is the gold-silver ratio calculated?
The ratio is calculated by dividing the current gold price per ounce by the current silver price per ounce. Many charting tools allow users to plot XAUUSD/XAGUSD directly, or the calculation can be done in a spreadsheet.
Is a high ratio a buy signal for silver?
A high ratio can indicate a possible setup, but it is not a guarantee. High readings have often marked periods when silver later outperformed, but timing can be slow and trends can remain stretched. Confirmation may include the ratio rolling over and silver showing improving relative strength.
What is the long-run fair level?
There is no fixed law. A July 2026 Silver Institute study points to a mean-reverting equilibrium just under 60 based on 1970 to May 2026 data. That level is a guide, not an iron rule.
Where can the live ratio be tracked?
MetalsCharts publishes a real-time ratio and recent ranges. Many trading platforms also allow custom charting by dividing gold by silver.
Does the ratio predict Bitcoin moves?
Not reliably. It can provide context on broad risk appetite, which sometimes overlaps with crypto flows, but crypto assets have separate drivers. The ratio is best used as macro color rather than a crypto trading signal.
Why can the ratio remain elevated for months?
Safe-haven demand for gold, weak industrial demand for silver, continued ETF outflows, energy-price changes, and policy shifts can all keep the spread wide and delay mean reversion.
What is a conservative way to use the signal?
There is no risk-free method. A more conservative approach is to adjust exposures gradually, wait for confirmation, and size positions so that timing risk is manageable. Costs, taxes, and the possibility of being early should always be considered.
Disclaimer: This article is provided for informational purposes only. It is not offered or intended to be used as legal, tax, investment, financial, or other advice.

