Technical Scoop: Gold Consolidates as U.S. Debt Approaches $40 Trillion
Key Takeaways
- •Gold rose 0.8% for the week, while silver gained 1.9%, platinum was flat, and palladium fell 4.6%.
- •Gold-mining stocks outperformed the metal, with the HUI up 1.9% on the week and the TSX Gold Index up 0.3%.
- •Chapman said U.S. debt near $40 trillion and annual deficits around $2 trillion are supportive factors for gold.
- •Central banks added 51 metric tonnes of gold in June, bringing 2026 purchases to 345 metric tonnes.
- •Chapman said gold needs to break above $4,500 to point to further gains, while silver would need to move above $70.
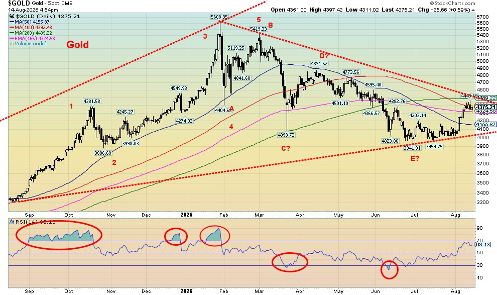
After a strong advance the previous week, gold prices consolidated over the past week, David Chapman writes in this excerpt from his weekly Technical Scoop column. Gold rose 0.8% on the week while silver gained 1.9%. Platinum was flat and palladium fell 4.6%. Copper continued to make all-time highs but closed off that high, up 0.5% for the week. Gold stocks extended their rally, with the Gold Bugs Index (HUI) — a basket of unhedged gold-mining companies — up 1.9% and the TSX Gold Index (TGD), which tracks gold-mining stocks, gaining 0.3%. "Nothing spectacular, but nonetheless there was follow-through to the upside. That's a positive," Chapman notes. Chart data: www.stockcharts.com
Debt as a Driver
Debt, debt, debt — that is a driver for gold, Chapman argues. U.S. debt is approaching $40 trillion — a total updated daily in published U.S. Treasury figures — and with annual deficits running at roughly $2 trillion, it could take only another five years to reach $50 trillion. Will global markets allow that to happen unheeded? "Not likely," he writes.
Central banks continue to raise gold reserves at the expense of adding U.S. debt. In June, central banks added 51 metric tonnes, bringing their purchases to 345 metric tonnes so far in 2026. Those totals are compiled in the World Gold Council's monthly central-bank statistics, which have shown official-sector gold buying running at historically elevated levels in recent years.
Gold remains under-owned by the public, making up only 3% of financial assets, Chapman observes. Central banks are buying, but "the public doesn't understand what is going on" — they view gold as a trade or a doomsday asset rather than a strategic core asset. India has the highest percentage of people owning gold; the North American public lags far behind. The largest minable reserves lie in Russia and Australia.
Technical Levels
Technically, gold still awaits a breakout over $4,500 to suggest a move to the next level; a breakout above that level could suggest a target of over $6,000. Silver awaits a breakout over $70, after which targets could become as high as $136.
Gold Stocks Leading
The gold stocks appear to be leading. The Gold/HUI ratio — a comparison of the gold price with the mining index, in which a falling ratio signals miners outperforming the metal — has fallen from 6.8 in July to 5.7. The HUI is now up 9.4% in 2026 and the TGD up 8.7%, while gold is up only 1.4%. Gold in Cdn$ is up 2.4% in 2026 as the Cdn$ has strengthened vis-à-vis the U.S. dollar. Silver is still down 9.1% in 2026. The big leader is copper, a widely watched gauge of global industrial demand, up 16.9% in 2026 — "gold follows copper," Chapman notes. The gold/silver ratio eased again this past week in favour of silver, consistent with the expectation that silver and gold stocks lead gold, the metal.
Seasonality
Gold has entered a positive seasonal period and appears to be rising on cue, Chapman writes. The rise can last into late September or October before another pullback gets underway into December, after which follows the strongest period for gold into March. "There are some crazy targets out there for gold. We tend to note them, but many appear to be pie in the sky. One step at a time. Let's get over $4,500 first."
Currencies Subdued
Currencies were also subdued this past week. Weak retail sales hurt the US$ Index, which pulled back but still managed a 0.1% gain on the week. The Cdn$ rose 0.5% while the euro was up 0.1%. After a big bounce following BOJ and U.S. Treasury intervention, the Japanese yen fell 1.1% this past week. "Is another intervention coming?" For readers following the forces behind these moves, the calendar ahead includes monthly U.S. inflation and employment releases, Federal Reserve policy decisions, and the World Gold Council's monthly central-bank gold statistics — recurring data points that gold and currency watchers routinely monitor.
Read the full report: Technical Scoop: Possible Inflation, Golden Sign, Oily Football, republished by SilverSeek.
Copyright David Chapman 2026.
Disclaimer
David Chapman is not a registered advisory service and is not an exempt market dealer (EMD) nor a licensed financial advisor. He does not and cannot give individualised market advice. David Chapman has worked in the financial industry for over 40 years, including at large financial corporations, banks, and investment dealers. The information in this newsletter is intended only for informational and educational purposes and should not be construed as an offer, a solicitation of an offer, or the sale of any security. Every effort is made to provide accurate and complete information; however, we cannot guarantee that there will be no errors. We make no claims, promises, or guarantees about the accuracy, completeness, or adequacy of the contents of this commentary and expressly disclaim liability for errors and omissions. David Chapman will always use his best efforts to ensure the accuracy and timeliness of all information. The reader assumes all risk when trading in securities, and David Chapman advises consulting a licensed professional financial advisor or portfolio manager such as Enriched Investing Incorporated before proceeding with any trade or idea presented in this newsletter. David Chapman may own shares in companies mentioned in this newsletter. Before making an investment, prospective investors should review each security's offering documents, which summarize the objectives, fees, expenses, and associated risks. Although Artificial Intelligence (AI) may be deployed from time to time, AI output is monitored and adjusted, if necessary, for accuracy. David Chapman shares his ideas and opinions for informational and educational purposes only and expects the reader to perform due diligence before considering a position in any security, including consulting a licensed professional financial advisor such as Enriched Investing Incorporated. Performance is not guaranteed, values change frequently, and past performance may not be repeated.
About the Author
David Chapman has worked in the financial industry for over 40 years, including at large financial corporations, banks, and investment dealers. Website: enrichedinvesting.com

