Gold ETF Inflows Build Toward 100 Million Ounces as $5,005 Technical Target Emerges
Key Takeaways
- •Global gold ETF holdings moved toward 100 million ounces after an eighth straight day of inflows, providing a publicly visible record of investor demand even as spot prices retreated.
- •Spot gold last traded around $4,339 after falling back below the $4,342-$4,345 support zone on the one-hour chart, leaving sellers in control of the short-term structure.
- •The 200-period EMA near $4,320 and the $4,310 area are the next downside references if buyers fail to reclaim the broken support zone.
- •Gold must clear the $4,394-$4,400 resistance area to restore upside momentum toward $4,502 and the September high near $4,700.
- •A measured-move projection still points to a target of roughly $5,005, representing about a 13.8% advance, though it serves as a reference level rather than a fixed outcome.
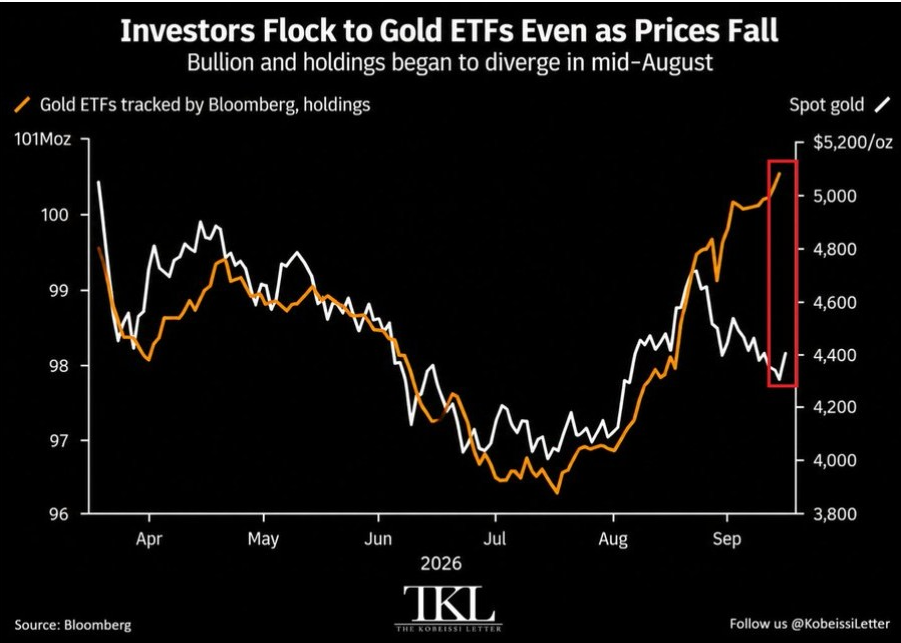
Spot gold lost ground in Monday's session while gold-backed exchange-traded funds kept accumulating, with global ETF holdings moving toward 100 million ounces after eight straight days of inflows. Because physically backed gold funds hold bullion in vaults and publish their holdings, the inflow streak provides a publicly visible record of investor demand even as the spot price retreats. The flow trend has opened a wide gap between rising fund holdings and a weaker spot price. A broader measured-move projection still places a target of roughly $5,005 in view, although the one-hour chart shows near-term downside pressure.
Key levels
- Gold trades near $4,347, with the 200-period EMA around $4,320 acting as nearby support.
- A break above $4,394 could open the path toward $4,502, the September high near $4,701, and the $5,005 target.
Gold Price Slips as ETF Holdings Rise
Gold traded near $4,350 after its rebound failed to hold, and last changed hands around $4,339. The one-hour chart shows price falling back below a support area around $4,342. Earlier buying pushed gold toward $4,400, but sellers rejected the move near the highs.
The price action then formed lower highs on the right side of the chart. Gold also printed a sharp wick toward $4,322 before attempting another recovery. That bounce failed to restore the support zone, leaving sellers in control of the short-term structure.
If spot gold catches up with the increase in ETF holdings, the gap could narrow through a higher gold price. However, ETF demand does not set a fixed price target: currency moves, bond yields, inflation expectations, and geopolitical risk can all change gold demand. Whether the eight-day inflow run extends will become clear from upcoming holdings updates.
Chart reference via X: https://x.com/ErhaXauusd/status/2102053568002044243?s=20
Support Under Pressure on the One-Hour Chart
The one-hour chart places immediate focus on the $4,342 to $4,345 zone. Gold used that area as support during earlier trading before slipping below it. A sustained move under the zone would keep the lower-high structure intact.
The chart points to roughly $4,310 as the next downside area if buyers fail to reclaim support. The 200-period EMA near $4,320 — an exponential moving average that weights recent prices more heavily — lies between the broken zone and that level. Gold could first retest the broken zone from below before another decline develops. A move back above $4,345 would weaken that immediate bearish setup and return attention toward $4,380.
Gold also needs to clear the $4,394 to $4,400 resistance area to restore stronger upside momentum. The chart shows repeated selling near that region. Until buyers break that ceiling, the short-term setup does not yet confirm a renewed push toward the recent highs.
The long lower wick near $4,322 shows buyers responded during the drop. However, price quickly returned toward $4,339 rather than extending higher. That reaction keeps the market close to the broken support zone and leaves both directions dependent on the next confirmed break.
Measured Move Toward $5,005
The broader gold price projection still tracks a measured move toward roughly $5,005, a level that represents about a 13.8% advance. A measured move is a charting technique that projects the size of an earlier price swing onto the current trend, which makes the $5,005 a reference level rather than a fixed outcome. Gold would need to clear several levels before that target becomes technically relevant. Resistance sits near $4,394, followed by $4,502 and the September high area around $4,700.
This article was first published by The Market Periodical.

