Gold's Bullish Falling Wedge Signals Potential Upside Breakout
Key Takeaways
- •Gold's 26.3% decline over 5.5 months from its late January peak has formed a classic falling-wedge chart pattern that technical analysts view as a bullish reversal formation typically resolving in an upside breakout.
- •At mid-July's latest low, gold closed at just 88.8% of its 200-day moving average, marking its most oversold level in 9.6 years.
- •Central-bank gold demand surged 62.4% year-over-year in the second quarter, reaching its strongest level in six quarters and extending a decade-plus structural shift toward net purchases.
- •American stock investors hold approximately one-third of one percent of their portfolios in gold via ETFs, an effectively negligible allocation that leaves substantial room for inflows.
- •Gold gained following the latest FOMC decision despite a more hawkish 9-to-3 split vote with dissenters advocating an immediate rate hike, demonstrating diminished sensitivity to bearish catalysts.
Gold's Bullish Falling Wedge Signals Potential Upside Breakout
Adam Hamilton
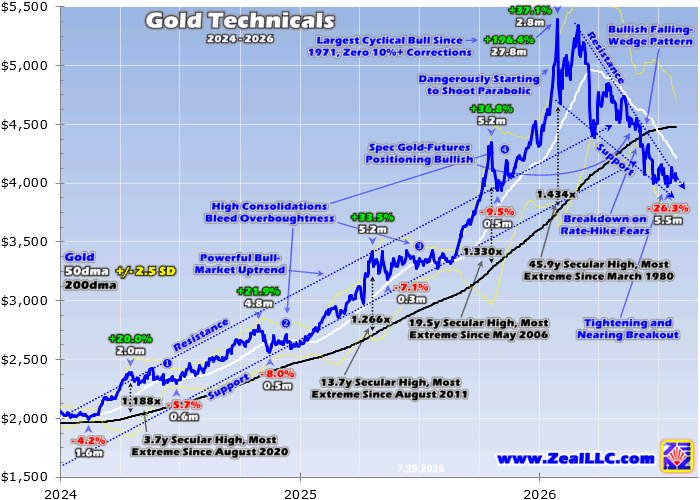
Gold has endured a substantial drawdown over the past half-year, a correction that followed an extreme peak capping the largest cyclical bull market in the metal's history in US-dollar terms. That rebalancing process left technical indicators battered and sentiment bearish. However, gold's corrective price action has consolidated into a massive falling-wedge chart pattern—a formation that is historically bullish and typically resolves in an upside breakout.
The January Peak and Inevitable Reckoning
In late January, gold had surged an extraordinary 196.4% over 27.8 months, constituting its largest cyclical bull market ever measured in dollar terms. The metal had gone parabolic in a speculative mania, reflected in extreme technical readings and wildly bullish herd sentiment. At its peak, gold traded 43.4% above its 200-day moving average—the most overbought level in 45.9 years, dating back to March 1980.
A serious reckoning was both necessary and inevitable to reverse those speculative excesses. Looking at gold's ten next-largest cyclical bulls since 1971—when the US dollar's gold standard was severed—the average subsequent drawdown was 20.8% over just 2.1 months. Indeed, over 1.8 months into late March, gold plunged 18.6%.
Extended Selloff: War, Fed, and Sentiment
That decline might have marked a solid bottom had gold's war-driven trade not intervened. Gold suffered repeated outsized down days driven by US-Iran escalations, safe-haven dollar rally threats, and regional central-bank selling. Because gold is priced in dollars on global markets, a stronger greenback typically pressures the metal by making it more expensive for non-dollar buyers—a well-documented inverse relationship that amplified each safe-haven dollar surge. The metal was also pressured by Fed-rate-hike fears, despite the new Fed chair's significant communication strategy shift that could ultimately liberate gold from years of Fed-driven pressure.
The combination of a normal post-peak drawdown, chaotic war news whipsawing markets, and traders struggling to interpret new Fed leadership extended gold's selloff considerably. By late July, the decline had reached 26.3% over 5.5 months—excessive by historical standards even following gold's largest bull markets.
Despite the persistent selling, gold's rate of descent decelerated markedly. Over 70% of the entire drawdown occurred within the first third of its duration. This moderating downslope formed the technical support line, while lower highs fell at a steeper pace as bearish sentiment deepened and traders grew reluctant to buy. That steeper downslope formed the resistance line. Together, these converging trendlines created a classic falling-wedge pattern.
Falling Wedge Mechanics
Falling wedges are defined by converging downward-sloping trendlines, with upper resistance declining faster than lower support. They typically exhibit waning volume over their lifespan, as accumulating technical damage and resulting bearishness erode buying motivation. The pattern coils prices progressively tighter, eventually forcing a breakout. Technical analysts generally look for expanding volume and a decisive close above the upper resistance trendline to confirm a genuine breakout rather than a false signal.
Falling wedges reflect slowing downside momentum—as capital outflows are gradually exhausted, sellers looking to exit find fewer counterparts willing to take the other side. The longer a selloff persists, the less selling fuel remains. Simultaneously, buyers increasingly step in as prices stabilize. Eventually, the balance shifts from diminishing selling pressure to growing buying pressure, reversing the selloff. Over more than a century of technical-analysis history, falling wedges have been recognized as reversal patterns that typically signal bottoming and lead to upside breakouts proportional to the pattern's size.
A falling wedge was impossible for gold in late January, when the metal soared to extreme overbought levels amid intense greed. That environment produced a vertical parabola, which always culminates in symmetrical crash-like plunges. Right after late January's peak, gold crashed 10.3% in a single trading day—its third-worst since 1971.
Sentiment and Technical Confirmation
Gold's massive mature falling wedge is corroborated by deeply bearish sentiment following the half-year selloff. The mainstream financial media that hyped gold in January has largely moved on. After months of drawdown, traders are either apathetic or bearish—expecting gold to continue grinding lower.
Extremely oversold technicals also confirm the pattern. At mid-July's latest low, gold closed at just 88.8% of its 200-day moving average—the most oversold level in 9.6 years. When prices are pushed back to decade-worst extremes, such deeply out-of-favor conditions historically favor contrarian buying.
Diminishing Shock Value
The shock value of factors driving gold's outsized down days is fading. The longer the US-Iran conflict persists—with escalatory attacks from both sides and Trump's capricious threats and proclamations on Truth Social—the more accustomed traders have become to the chaotic newsflow. After five straight months, it increasingly registers as background noise.
Fed-rate-hike fears are similarly losing potency. At Kevin Warsh's first FOMC meeting as Fed chair in mid-June, he struck a hawkish tone, promising to "deliver price stability." Gold suffered a brutal 3.7% intraday plunge from its pre-Fed rally, closing 1.6% lower. Over five trading days following that decision, gold dropped 7.8% on perceived Fed hawkishness.
Six weeks later, this Wednesday's FOMC decision was arguably even more hawkish. Unlike mid-June's unanimous 12-to-0 vote against hiking, this week's decision split 9 to 3, with dissenters advocating an immediate 25-basis-point rate hike. Yet gold surged 2.9% intraday across the FOMC announcement before settling at a +0.6% close. By midday Thursday, gold was following through with an additional 1.1% gain.
This stronger price behavior is precisely what one would expect from a mature falling wedge. As selloffs persist, selling becomes increasingly exhausted and buyers gain the upper hand. Gold has been reacting less to news that would have driven sharp declines a month or two earlier—a notably constructive sign.
Fundamental Support
Fundamental factors also support an imminent upside breakout. American gold-futures speculators' total longs, or upside bets, are running just 9.3% above late May's deep 3.5-year secular low, leaving substantial room for leveraged buying. Historically, large gold-futures long buying fuels early-stage gold uplegs.
A proxy for American stock investors' gold allocations can be derived by comparing bullion held by the US-listed GLD, IAU, and GLDM gold ETFs against the S&P 500's collective market capitalization. Midweek after the latest FOMC, these ETFs held $219.1 billion in gold—dwarfed by the S&P 500 components' $66,513.8 billion valuation. This implies American stock investors' gold allocations are approximately one-third of one percent, effectively negligible.
Gold is also entering its strong seasonal period. Demand is structurally elevated in autumn and winter, driven in part by India's wedding and festival season—where gold jewelry is a deep-rooted cultural tradition—and Chinese New Year gifting. During 22 of the last 25 years when gold was in bull markets, autumn, winter, and spring rallies averaged gains of 5.5%, 7.9%, and 4.3% respectively.
Central Bank Demand
In mid-March, gold plummeted 14.9% in eight trading days after Turkey's central bank sold approximately one-tenth of its official gold reserves to raise funds for its plunging currency, which had fallen to record lows against the dollar as war-driven oil prices threatened Turkey's economy. That event catalyzed gold's war-driven trade.
The World Gold Council's quarterly Gold Demand Trends reports provide the best-available global supply-and-demand data. Q1 data, released in late April, showed central-bank demand grew 2.8% year-over-year despite the then-nascent war. Q2's report, published overnight into Thursday, showed global central-bank demand soaring 62.4% year-over-year to its strongest levels in six quarters. This acceleration extends a structural shift that has seen central banks as net gold buyers for more than a decade—a sharp reversal from the net selling that characterized much of the late twentieth century—reflecting strategic interest in reserve diversification, particularly among emerging-market economies.
Conclusion
Gold's drawdown over the past half-year has consolidated into a massive falling-wedge formation. The pattern's convergence, combined with bearish sentiment, deeply oversold technicals, low futures positioning, negligible investor allocations, strong central-bank demand, and favorable seasonals, collectively supports the case for an approaching major upside breakout. As gold's falling wedge yields to a sustained rally, battered gold mining stocks are positioned to benefit from their inherent operational leverage to the metal's price.
Adam Hamilton, CPA
July 31, 2026
Copyright 2000–2026 Zeal LLC (www.ZealLLC.com)

