Gold Posts Best Week Since August as Gold Stocks Rebound: Technical Scoop
Key Takeaways
- •Gold jumped 4.8% for the week, its strongest performance since August, while silver gained 5.5%, with the U.S. election outcome appearing to boost the metal.
- •Gold mining shares outperformed, with the Gold Bugs Index (HUI) up 13.5% and the TSX Gold Index (TGD) up 15.7%, leaving both indices positive on the year.
- •Gold stock indices formed higher lows even as gold and silver printed new lows in the decline from the January 2026 top, a divergence Chapman views as an encouraging signal.
- •Chapman warns the market is not out of the woods and expects possible choppiness until the December 8–9 FOMC meeting, where the Federal Reserve is anticipated to hike rates after a bullish jobs report.
- •Confirmation levels for a bottom include a gold breakout above $4,400 to $4,500, silver reclaiming $60 with $70 confirming the low, and the TGD holding its low near 750.
Gold Posts Best Week Since August as Gold Stocks Rebound: Technical Scoop
Commentary by David Chapman, published on SilverSeek, November 9, 2026. Charts referenced in this column are sourced from StockCharts.com.
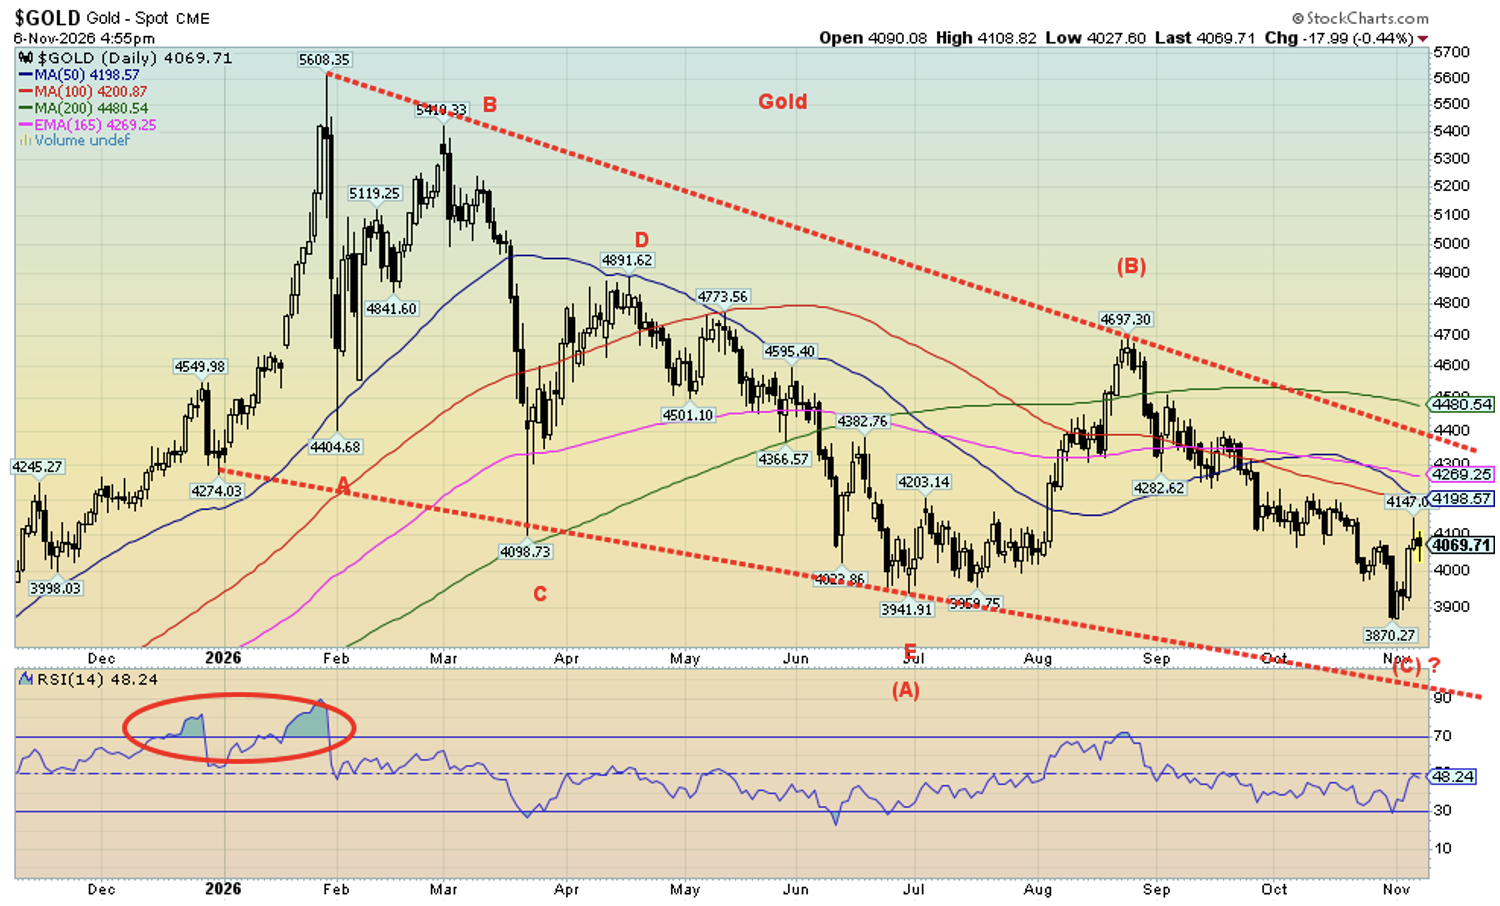
Have gold and precious metals finally bottomed? That is the question at the heart of this week's Technical Scoop from market commentator David Chapman, and the answer, in his view, is cause for encouragement. The outcome of the U.S. election appeared to give gold a boost, ending a three-week losing streak and delivering the metal's best weekly performance since August.
Gold did slip about 0.5% on Friday, but silver and the gold stocks did not follow it lower. For the week as a whole, gold leaped 4.8% and silver climbed 5.5%. It was the gold equities, however, that truly shone: the Gold Bugs Index (HUI) — an index of gold-mining companies — surged 13.5%, while the TSX Gold Index (TGD), which tracks gold stocks listed on the Toronto Stock Exchange, rose 15.7%. The rally was strong enough that both the HUI and the TGD are once again positive on the year.
Divergence: Miners Set Higher Lows as Metals Made Lower Lows
Chapman had previously flagged a divergence between the gold stock indices and the metals themselves, and the latest week reinforced it. Both gold and silver carved out fresh lows in the decline that began from the January 2026 top, but the HUI and the TGD did not. The two equity indices held above their recent lows and have generally outperformed gold and silver on a performance basis.
The numbers make the case. Gold equities carry operating leverage to the metal's price, so they tend to amplify gold's swings in both directions — which is why a divergence of this kind is the sort of signal technical watchers track. From the January 2026 peak to the July low, gold lost 31% and silver was hammered, down 60%, while the HUI fell 41% and the TGD only 38%. At the more recent low, the HUI was down 35% and the TGD off 32% — higher lows for the miners even as the metals printed lower lows. Chapman calls that a strong performance for gold stocks, which in a normal environment would have suffered drops of around 70% in a decline where gold fell 30%.
Encouraged on a Bottom, but Not Out of the Woods
The result, Chapman writes, is encouragement that gold may have seen its low, and a more positive seasonal period for gold and silver is now underway. He nevertheless cautions that the market is not out of the woods yet, and he would not be surprised to see a choppy pattern persist until the December 8–9 FOMC meeting — a gathering of the Federal Open Market Committee, the Federal Reserve's rate-setting body — and the interest rate decision.
Gold still fears higher interest rates; because bullion pays no yield, rising borrowing costs raise the opportunity cost of holding it. Expectations for the moment remain that the Federal Reserve will hike at its next meeting, especially after the bullish jobs report. As long as no new lows are made, Chapman sees a set-up that could carry through the Fed period before the market really starts to rise.
Key Technical Levels
On the charts, gold failed to reach its downtrend line, while silver remains in what looks like a huge descending wedge triangle — a pattern Chapman characterizes as bullish. The breakout point for gold sits above $4,400, though he would prefer to see a move above $4,500 to confirm a low. For silver, the breakout threshold is above $60, and regaining ground above $70 would confirm the bottom.
The TGD pattern is different. A breakout above 900 would be positive, and especially so above 1,000. What is key, he argues, is that the low near 750 holds on any further pullback. "We like the odds," he writes.
Taken together, those price thresholds and the December rate decision form the near-term checklist for judging whether the rebound holds.
Macro Backdrop: Gridlock, Geopolitics and Capital Flight
The wider backdrop, in Chapman's assessment, offers potential support. A gridlocked U.S. government is a positive, and turmoil will continue in the United States. With Trump still in charge of foreign policy, a restart of the U.S./Iran war could also prove positive for gold. He adds a reminder that Trump, even at 30% approval, still counts more than 50 million believers.
Another potential source of market turmoil is the ongoing upheaval in the EU, particularly France, where capital flight could emerge — especially if rhetoric against Russia amps up further. In Chapman's view, such capital flight could in turn be positive for U.S. bond and stock markets, as well as for gold, silver and the gold stocks.
Copyright and Disclaimer
Copyright David Chapman 2026.
David Chapman is not a registered advisory service and is not an exempt market dealer (EMD) nor a licensed financial advisor. He does not and cannot give individualised market advice. David Chapman has worked in the financial industry for over 40 years, including at large financial corporations, banks, and investment dealers. The information in this newsletter is intended only for informational and educational purposes. It should not be construed as an offer, a solicitation of an offer or sale of any security. Every effort is made to provide accurate and complete information. However, we cannot guarantee that there will be no errors. We make no claims, promises or guarantees about the accuracy, completeness, or adequacy of the contents of this commentary and expressly disclaim liability for errors and omissions in the contents of this commentary. David Chapman will always use his best efforts to ensure the accuracy and timeliness of all information. The reader assumes all risk when trading in securities, and David Chapman advises consulting a licensed professional financial advisor or portfolio manager such as Enriched Investing Incorporated before proceeding with any trade or idea presented in this newsletter. David Chapman may own shares in companies mentioned in this newsletter. Before making an investment, prospective investors should review each security's offering documents, which summarize the objectives, fees, expenses, and associated risks. Although Artificial Intelligence (AI) may be deployed from time to time, AI output is monitored and adjusted, if necessary, for accuracy. David Chapman shares his ideas and opinions for informational and educational purposes only and expects the reader to perform due diligence before considering a position in any security. That includes consulting with your own licensed professional financial advisor such as Enriched Investing Incorporated. Performance is not guaranteed, values change frequently, and past performance may not be repeated.
About the Author
David Chapman has worked in the financial industry for over 40 years, including at large financial corporations, banks, and investment dealers. He shares his ideas and opinions for informational and educational purposes only, and his commentary is published at enrichedinvesting.com.
Source: Technical Scoop: Job Divergence, Gold Leap, Bull Life, SilverSeek, November 9, 2026. The full report is also published at GoldSeek.

