Precious Metals Sector Signals Major New Uptrend, Says Technical Analyst Clive Maund
Key Takeaways
- •Technical analyst Clive Maund reports that silver's correction following a parabolic blowoff has run its course, forming a bullish Falling Wedge pattern on the 1-year chart with improving MACD momentum.
- •A tightly pinched Bollinger Band condition on silver's 1-year chart, last observed one year ago before a significant move, combined with a rising Stochastic indicator, increases the probability of an upside breakout.
- •Silver's powerful breakout last autumn from a 45-year Cup & Handle pattern was followed by a normal post-breakout reaction, which Maund contends should give rise to a substantial second upleg potentially exceeding last year's gains.
- •The Gold Miners Bullish Percent Index sits at 21.6% bullish, a level generally considered oversold territory below 30%, indicating significant capacity for the mining sector to advance from current levels.
- •Maund attributes the long-term bullish case for precious metals to the ongoing global debasement of fiat currencies and plans to review specific gold and silver mining stocks in future articles.
Technical analyst Clive Maund reports that multiple converging factors suggest the precious metals sector is positioned for a major new uptrend, according to analysis published on Clive Maund's website and syndicated by GoldSeek.
Maund notes that one factor previously giving him pause — the potential for a broad market crash or severe downturn — appears to be mitigated by continued large-scale monetary expansion. He cites a proposal to provide Iran with US$300 million for reconstruction contingent on certain conditions as illustrative of the desperation to create money, though he acknowledges Iran is not obligated to comply.
Silver Technical Analysis
Maund presents a range of silver charts to support his assessment.
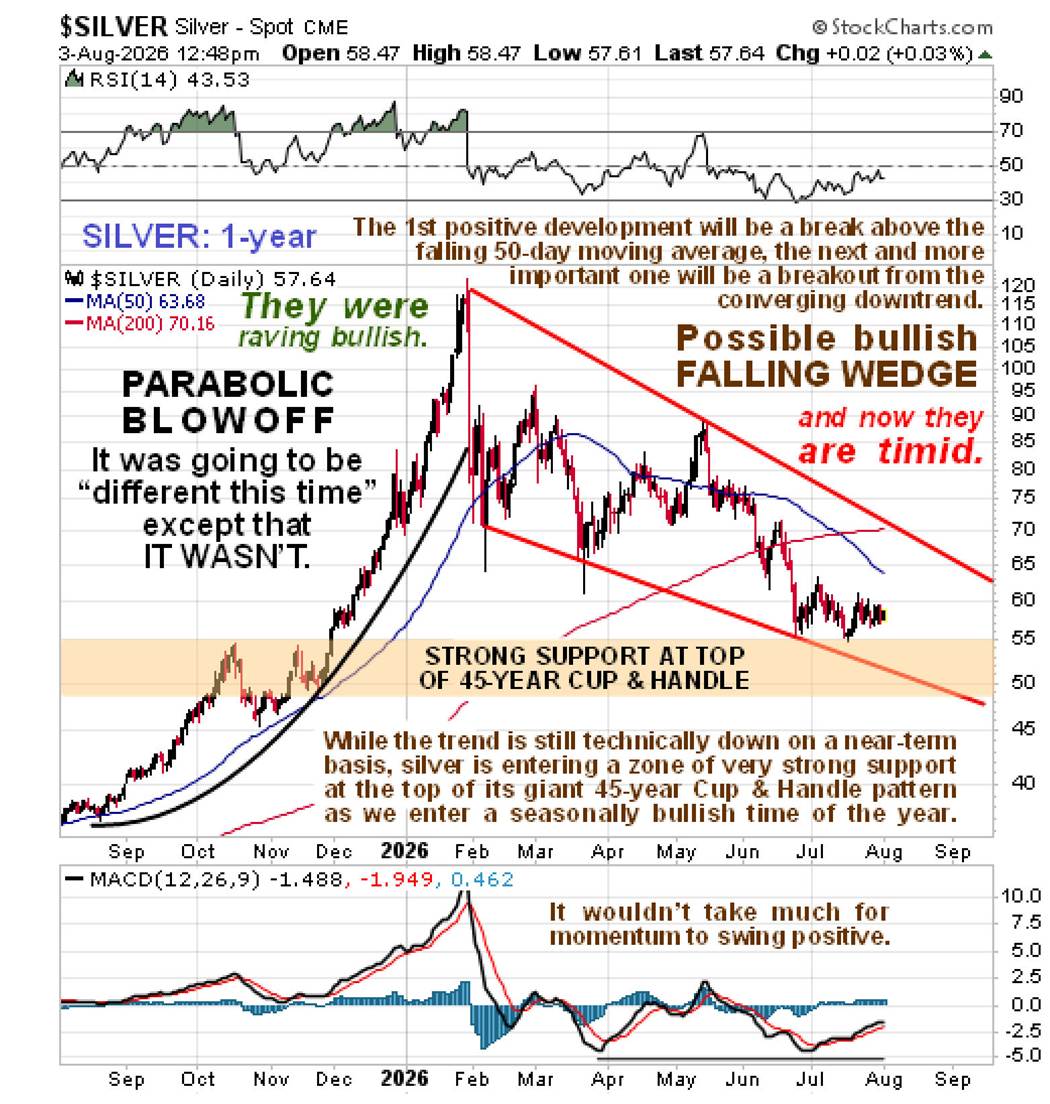
On a 1-year silver chart, he identifies the correction following a parabolic blowoff as having run its course, forming what he describes as a bullish Falling Wedge pattern. The price has returned to strong support at the upper boundary of a large 45-year Cup & Handle holding pattern — a classic long-term bullish continuation formation first popularized by William O'Neil — which he examines further on the very long-term chart. Silver is currently below a still-rising 200-day moving average, with momentum (MACD) improving. Maund also highlights the seasonal factor, noting that the precious metals have entered a historically favorable time of year.
Examining the same 1-year chart with Bollinger Bands and Stochastics overlaid, Maund points out that the Bollinger Bands are tightly pinched — a condition last observed one year ago on the same chart, which preceded a significant move. The Stochastic indicator is trending higher, which he interprets as increasing the probability of an upside breakout.
On the 5-year silver chart, Maund observes that the price has reacted back into a zone of strong support reinforced by a lower parabolic uptrend. Given the strength of silver's breakout in the prior autumn, he argues it is unlikely that the price would need to penetrate deeply into this support before advancing again.
Long-Term Cup & Handle Pattern
Maund describes the 45-year silver chart as his preferred long-term reference. He states that silver's powerful breakout from this gigantic Cup & Handle holding pattern last autumn was followed by what he considers a normal post-breakout reaction back to the pattern's upper boundary. This, he contends, should give rise to a substantial second upleg that could carry the price well beyond the pattern, potentially exceeding last year's gains. He adds that a retreat back into the pattern after such a decisive breakout would be highly unusual.
For comparison, Maund includes a gold chart covering the same period from 1980 onward, prepared on August 4 and published the morning of August 5. He also references a 20-month chart for GDX (the VanEck Gold Miners ETF, which tracks major gold mining companies and is one of the most widely held mining-sector ETFs), prepared on the same dates, which he describes as presenting a similarly favorable setup.
Additionally, Maund cites the Gold Miners Bullish Percent Index at a reading of 21.6% bullish, indicating significant capacity for the sector to advance from current levels. The Bullish Percent Index is a breadth indicator that tracks the percentage of stocks in a given sector on point-and-figure buy signals, with readings below 30% generally considered oversold territory.
Looking Ahead
Maund states that he plans to review a selection of gold and silver mining stocks in future articles. In the meantime, he directs readers to prior coverage on his site, noting that many previously analyzed companies remain relevant.
The article was posted at 9:30 am EDT on August 4, 2026.
About the Analyst
Clive Maund (clivemaund.com) has covered the gold and silver markets through the boom phase that began around 2005 and peaked in 2011. He views the subsequent bear market as analogous to the mid-1970s two-year correction, which was preceded by a powerful advance and followed by a major parabolic rally. He attributes the long-term bullish case for precious metals to the ongoing debasement of fiat currencies globally.
Source: GoldSeek

