以太坊價格測試主要供應區,分析師目標指向 $2,773
重點速覽
- •ETH 先從約 $1,796 漲至接近 $1,955,之後在 7 月 23 日因買盤失去動能而回落至約 $1,878。
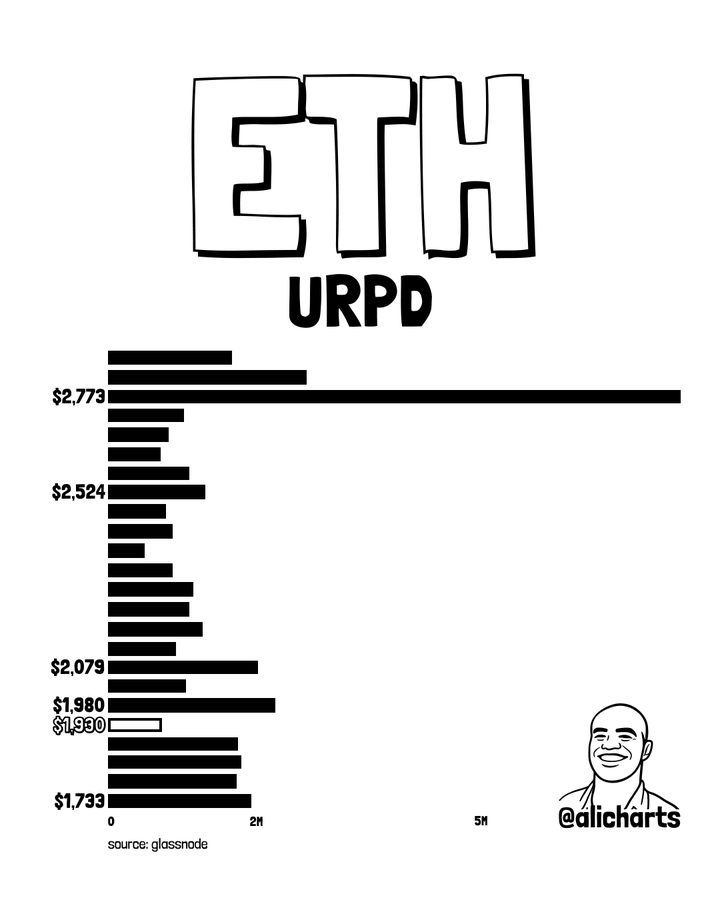
- •最近的鏈上最強阻力集中在 $1,980 至 $2,080 之間,許多持有人可能會在接近平本時賣出。
- •若能明確收於 $2,080 上方,$2,406–$2,644 的 CME 缺口與 $2,773 目標都可能進入視野。
- •若 ETH 再次在阻力下方遭到否決,價格可能回測 $1,733,並進一步下探至 $1,510–$1,600 支撐區。
- •週線圖顯示,以太坊正測試自 2025 年高點延伸的下降趨勢線,同時仍守在自 2022 年低點形成的上升支撐之上。
Ethereum price is pressing against a long-running technical barrier after recovering from its June lows. ETH rose from about $1,796 to a recent high near $1,955 before closing near $1,878 on July 23, when sellers rejected the rebound.
Spot charts showed an early trendline break, but the weekly structure and Chicago Mercantile Exchange market still need stronger confirmation above resistance. Onchain data also indicates heavy supply between $1,980 and $2,080, a range that has become important because it sits just above the latest recovery zone and may attract holders looking to exit near breakeven if price revisits it. A breakout through that region could expose the CME gap and the larger $2,773 target, while another rejection would leave lower support levels in play.
以太坊價格面臨 $1,980–$2,080 供應區
Ethereum price is trading near $1,880 after failing to hold above the $1,978 resistance level. Ali Charts identified the broader $1,980–$2,080 area as Ethereum’s strongest nearby on-chain resistance zone.
The URPD chart shows a concentrated amount of ETH previously acquired within that range. Holders who bought there may look to sell near breakeven, adding pressure if ETH attempts another recovery.
Above that area, the distribution profile also shows a notable supply cluster around $2,524. The largest visible concentration, however, sits near $2,773, which makes that level the next major target after a confirmed breakout.
Ethereum’s recent on-chain golden cross supports the broader recovery case, but price confirmation remains necessary. Buyers would need a decisive daily close above $2,080 before the bullish signal could translate into a stronger market structure.
ETH 測試長期下跌趨勢
MikybullCrypto’s weekly chart shows Ethereum challenging a descending trendline drawn from its 2025 peak. At the same time, price remains above a rising support area that has developed since the 2022 market low.
The chart reflects a broad multi-year base, with ETH repeatedly finding buyers near the lower structural boundary. The latest rebound has brought price back toward the point where descending resistance and rising support converge, a setup that often draws closer attention from traders watching weekly closes rather than intraday moves.
On some spot charts, ETH has already moved through a shorter multi-month trendline. Even so, the weekly candle must hold above that barrier to reduce the risk of another failed breakout.
MikybullCrypto expects a possible 5x move from current levels over the longer term. That kind of advance would require ETH to reclaim several hurdles, including $2,080 and the historical resistance zone near $4,700–$4,800.
ETH CME 缺口位於突破區上方
The Ether futures chart also shows price testing another descending trendline extending from the October 2025 high. Ethereum is currently trading just below that line after recovering from the June decline.
An unfilled CME gap remains between roughly $2,406 and $2,644. Gerla said a confirmed trendline breakout could allow ETH to move quickly toward that area as the market searches for liquidity.
The lower boundary of that gap is also close to the broader on-chain supply zone around $2,524, giving the region added technical importance and increasing the possibility of profit-taking during a continued recovery.
Before ETH can reach the gap, it must first clear $1,980 and establish support above $2,080. Continued rejection below those levels would keep the futures gap out of reach and preserve the wider bearish structure.
以太坊價格需要突破確認
Ethereum has shown early recovery signs since rebounding from its June lows, but the immediate test remains the dense supply zone between $1,980 and $2,080.
A decisive close above that area could expose $2,406–$2,644, bringing the wider $2,773 target into view.
If price is rejected again, ETH could fall back toward $1,733. Further weakness would expose the deeper $1,510–$1,600 support zone.
The CME gap, the fivefold projection, and the $2,773 target are technical scenarios, and none of them guarantees Ethereum will reach those levels.
Short-term direction now depends on whether buyers can turn $1,980–$2,080 from resistance into support.