Прогноз цены Ethereum: главные причины, по которым ETH может резко вырасти в сентябре
Ключевые выводы
- •Ethereum достиг максимума с 31 января после резкого роста 19 августа, завершив период консолидации.
- •На дневном графике сформировались бычий флаг и золотой крест, при этом цена остается выше индикатора Supertrend.
- •ETF на Ethereum показали 13 дней подряд притоков, месячные притоки превысили $1.85 billion, а совокупные притоки достигли $13 billion.
- •Сейчас застейкано более 42.5 million ETH, что подняло коэффициент стейкинга до 35.25% и увеличило стоимость застейканных токенов выше $105 billion.
- •Открытый интерес по фьючерсам на Ethereum вырос до $32.5 billion, а объем ETH на биржах снизился до 11.9 million токенов с прошлогоднего максимума в 17.8 million.
Ethereum price has performed strongly over the past few weeks and is now hovering near its highest level in months. The coin has gradually formed several bullish chart patterns, while ETF inflows, staking activity, and futures positioning have added context to the move.
Ethereum Price Has Formed Bullish Patterns
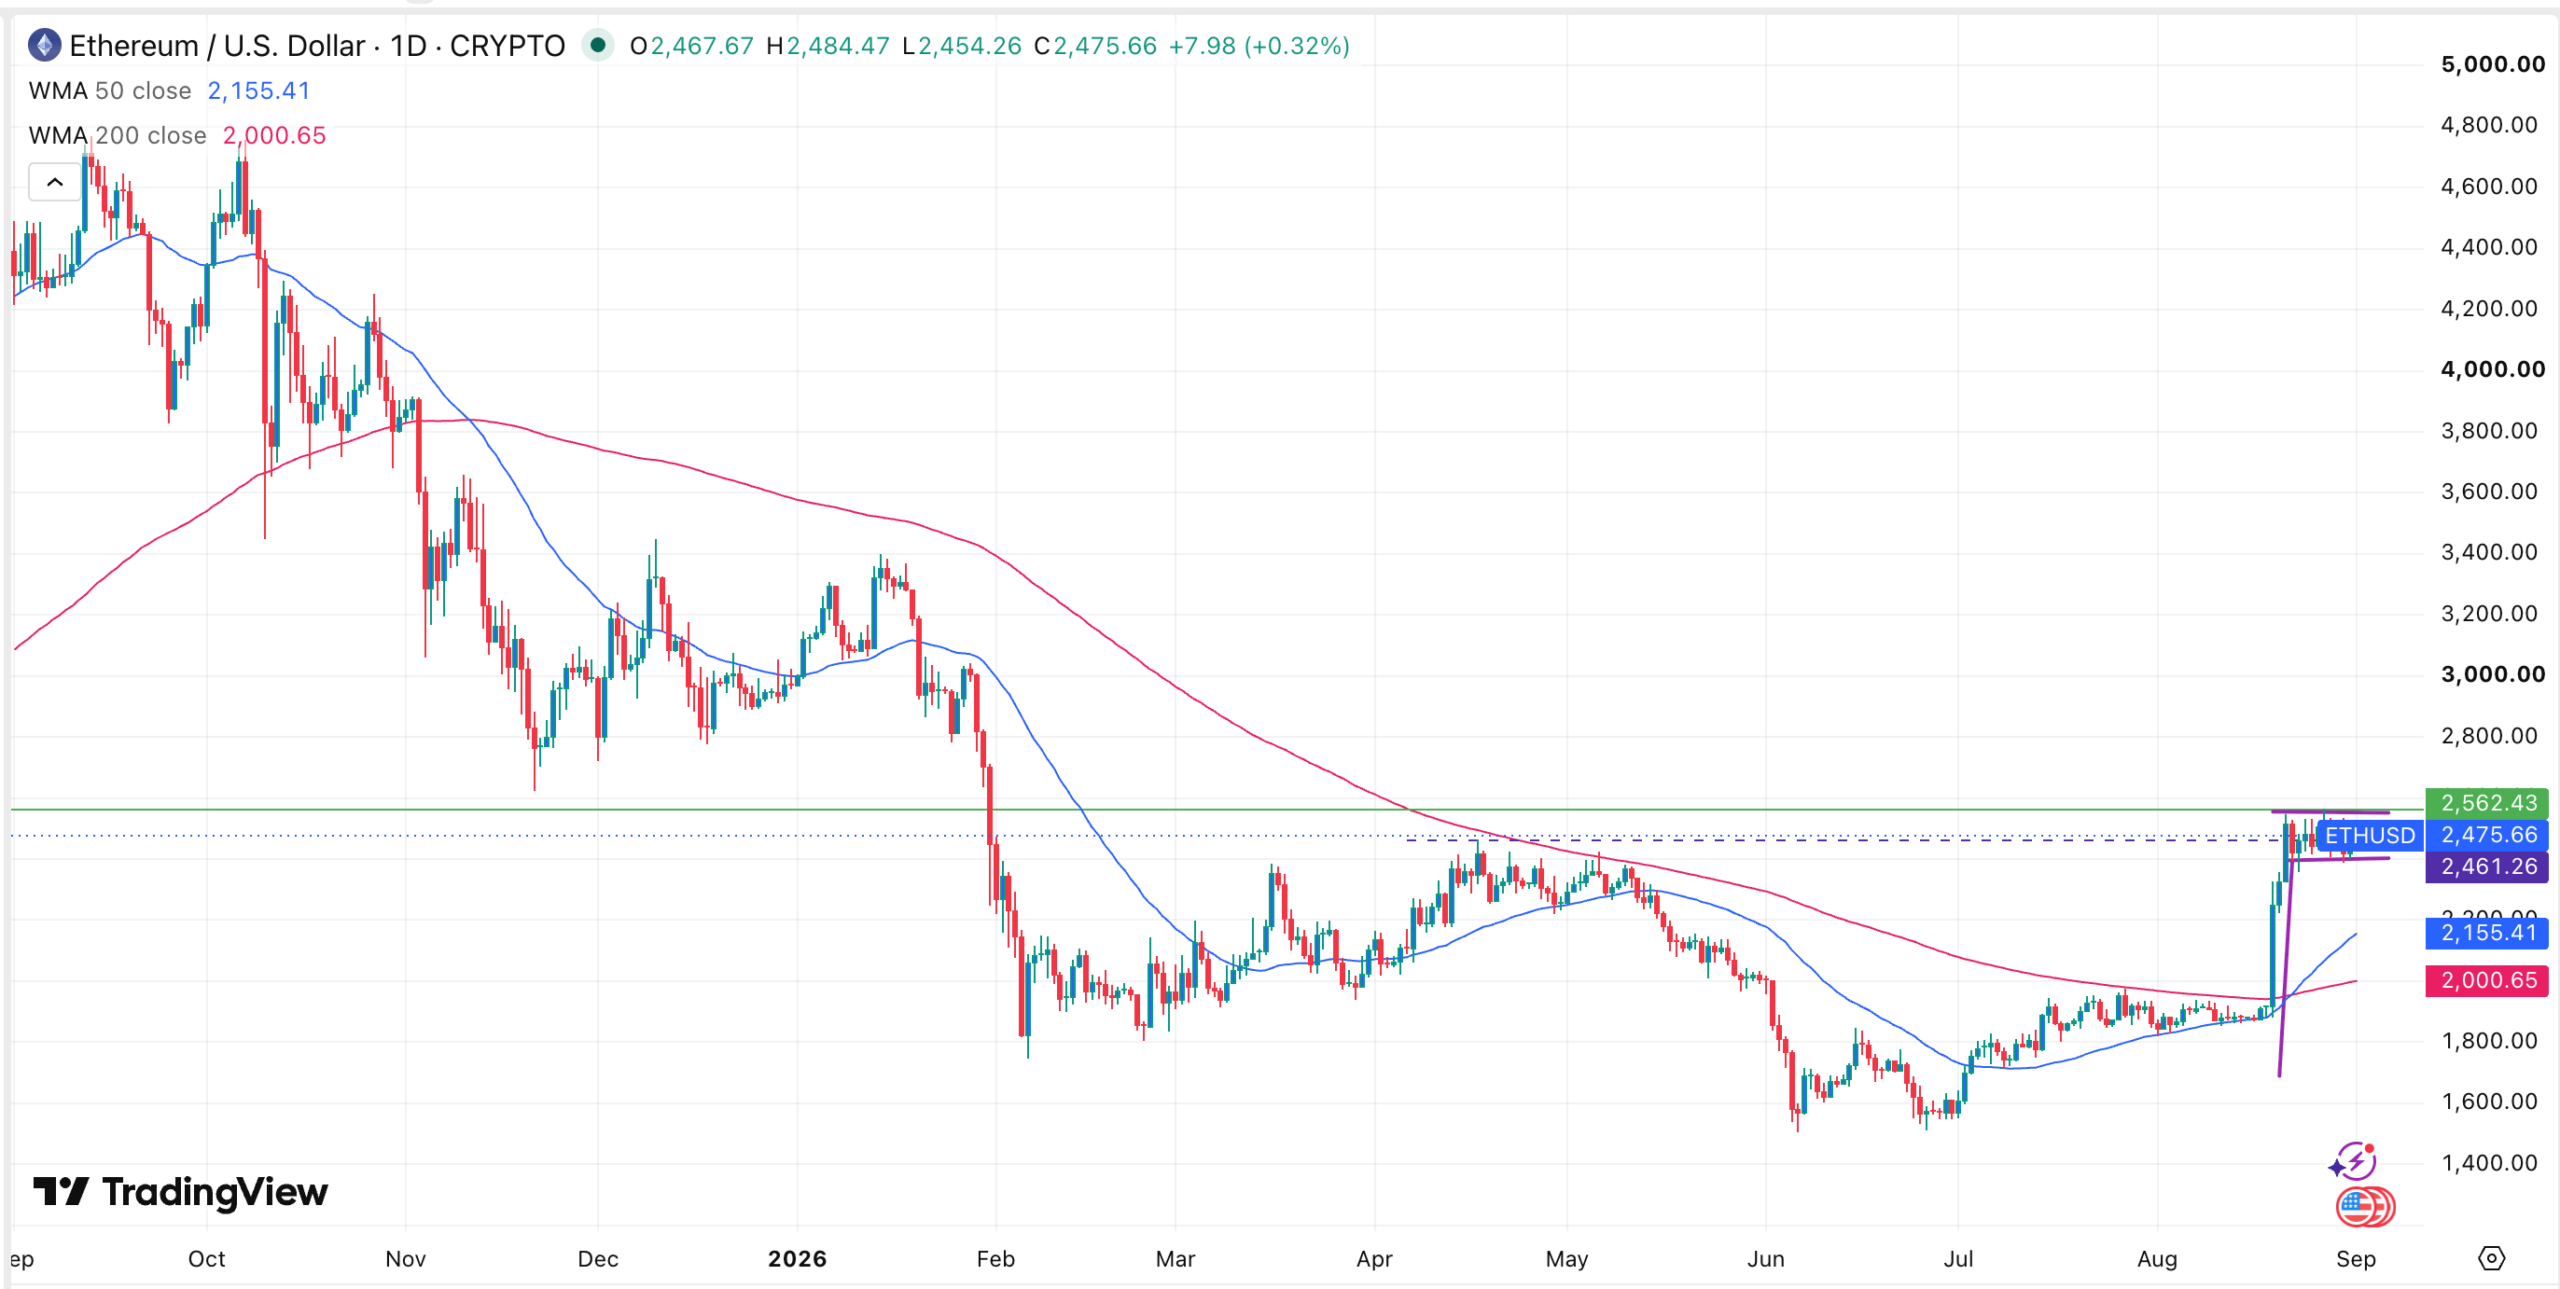
The daily chart shows that ETH price remained in a consolidation phase in July and during the first few weeks of August. That consolidation ended on August 19, when the token went parabolic and reached its highest level since January 31.
A closer look suggests that the coin still has room to run in the coming weeks. It is in the process of forming a bullish flag pattern, which typically appears after a major rebound followed by a horizontal consolidation. This pattern often leads to a strong bullish breakout over time.
ETH price has also formed a golden cross pattern, which occurs when the 50-day Weighted Moving Average crosses above the 200-day Weighted Moving Average. This pattern signals that short-term momentum is accelerating.
Ethereum’s price has remained above the Supertrend indicator, while the three Bollinger Band lines have compressed. That compression suggests that volatility has eased in recent days, which is often the kind of setup traders watch when price is near a nearby resistance level.
As a result, the coin could see a strong bullish breakout in the coming weeks as investors target the key resistance level of $3,000. A move above that level would raise the possibility that the coin could surge to a record high by the end of the year.
Ethereum ETF Inflows Are Rising
Fundamentals suggest that ETH demand continues to increase this year. Data compiled by SoSoValue shows that these funds added more than $87 million on August 31.
Ethereum ETFs have posted 13 consecutive days of inflows, bringing monthly inflows to more than $1.85 billion, the highest level this year. These funds have recorded cumulative inflows of $13 billion and now hold more than $15 billion in assets under management.
BlackRock continues to lead in both inflows and assets. Its flagship ETF, ETHA, has more than $8.69 billion in assets. The recently launched ETHB ETF has become the fastest-growing Ethereum ETF, with more than $906 million in assets today. ETHB differs from ETHA and other funds because it stakes the tokens, allowing investors to earn a monthly return that stands at over 2.5%.
ETHB’s and BitMine’s staking help explain why Ethereum staking inflows have risen in recent weeks. More than 42.5 million tokens have been staked, a 0.68% monthly increase that has lifted the staking ratio to 35.25%. The staked tokens are now worth more than $105 billion in assets.
Crypto Fear and Greed Index Remains Elevated
Other fundamentals also suggest that the coin’s outlook is improving. The popular Crypto Fear and Greed Index has climbed to the greed zone of 75, indicating that investors have embraced a risk-on sentiment. Cryptocurrencies often perform well when this index is rising.
Additional data shows that Ethereum futures open interest has remained steady in recent weeks. Open interest climbed to $32.5 billion, its highest level since May 11 and well above the June low of $21 billion. This increase suggests that demand for the coin continues to rise, while the higher level of open interest shows that derivatives activity remains elevated alongside spot market interest.
Meanwhile, the amount of ETH held on exchanges has continued to decline in recent months. There are now 11.9 million tokens on exchanges such as Binance and Coinbase, down sharply from last year’s high of 17.8 million. That decline is another sign of strong investor demand and leaves fewer tokens readily available on trading venues.
